List of regions of Tanzania by Human Development Index
This is a list of regions of Tanzania by Human Development Index based on data for the year 2022.[1]
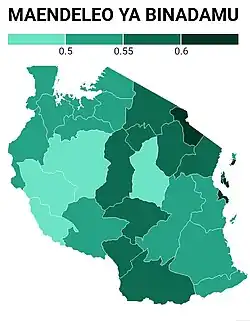
| Rank | Region | HDI | ||
|---|---|---|---|---|
| 2022 | Change from 2017 | 2022 Score | Change from 2017 | |
| Medium human development | ||||
| 1 | Zanzibar City | 0.678 | ||
| 2 | Dar es Salaam | 0.653 | ||
| 3 | Kilimanjaro | 0.640 | ||
| 4 | South Zanzibar | 0.639 | ||
| 5 | South Pemba | 0.603 | ||
| 6 | North Zanzibar | 0.584 | ||
| 7 | Iringa & Njombe | 0.577 | ||
| 8 | Tanga | 0.569 | ||
| 9 | Arusha & Manyara | 0.568 | ||
| 10 | Ruvuma | 0.555 | ||
| 11 | Singida | 0.554 | ||
| Low human development | ||||
| 0.549 | ||||
| 12 | North Pemba | 0.548 | ||
| 13 | Morogoro | 0.546 | ||
| 14 | Mbeya | 0.543 | ||
| 15 | Mara | 0.541 | ||
| 16 | Pwani | 0.525 | ||
| 17 | Geita & Mwanza | 0.523 | ||
| 18 | Kagera | 0.521 | ||
| 19 | Kigoma | 0.520 | ||
| 20 | Lindi | 0.509 | ||
| 21 | Shinyanga & Simiyu | 0.508 | ||
| 22 | Mtwara | 0.507 | ||
| 23 | Dodoma | 0.497 | ||
| 24 | Katavi & Rukwa | 0.483 | ||
| 25 | Tabora | 0.482 | ||
See also
References
- ^ "Sub-national HDI - Subnational HDI - Global Data Lab". globaldatalab.org. Retrieved 18 December 2019.