2015 United Kingdom general election|
|
All 650 seats in the House of Commons of the United Kingdom
326 seats needed for a majority |
| Turnout | 66.4% |
|---|
|
This lists parties that won seats. See the complete results below. |
This is the results breakdown of the 2015 United Kingdom general election.
Swing
The shares of votes of each party changed as follows:
The following table is a list of seats changing hands as a result of the election based on the results of the 2015 election compared to the General Election held in May 2010,[1] and so notwithstanding the results of by-elections to the 55th Parliament.
The Conservative Party became the first party in government since the 1983 general election to increase the number of seats they held at a general election. In total they gained 24 seats to win an overall majority of 12.[2] They gained six seats from Labour in England and two in Wales, while also winning 16 seats from their former coalition partners, the Liberal Democrats.
The Labour Party had a net loss of 26 seats, see table below. Although they did gain twelve seats in England from the Conservatives (eight of them in London) and 23 from the Liberal Democrats, they suffered their worst defeat in Scotland in the age of universal suffrage, losing forty of their forty-one seats to the Scottish National Party (SNP).[3] They also had a net loss of one seat in Wales.[4] Ed Miliband immediately resigned as leader, handing over temporarily to deputy leader Harriet Harman.
The SNP enjoyed their best election result, gaining forty seats from Labour and ten from the Liberal Democrats to hold 56 of Scotland's 59 constituencies.[3] The other parties held one seat each.
The Liberal Democrats had been part of a coalition government with the Conservatives prior to the election with 57 seats in parliament. However, they held just eight seats, their worst election result since the old Liberal Party secured six seats in 1970.[5] Of the five Liberal Democrat cabinet ministers, three lost their seats.[6] They also lost 338 deposits.[7] As a result, Nick Clegg, although he was one of the two surviving ministers, resigned as leader.[6]
The Green Party and UK Independence Party (UKIP) each held one seat: UKIP, however, failed to defend Rochester and Strood, which it had won in a by-election in 2014.[8]
Seats changing hands
Seats changing hands at May 2015 General Election relative to May 2010
| Seat
|
2010 election
|
2015 election
|
| Aberdeen North
|
|
Labour
|
|
SNP gain
|
| Aberdeen South
|
|
Labour
|
|
SNP gain
|
| West Aberdeenshire and Kincardine
|
|
Liberal Democrats
|
|
SNP gain
|
| Airdrie and Shotts
|
|
Labour
|
|
SNP gain
|
| Argyll and Bute
|
|
Liberal Democrats
|
|
SNP gain
|
| Ayr, Carrick and Cumnock
|
|
Labour
|
|
SNP gain
|
| Bath
|
|
Liberal Democrats
|
|
Conservative gain
|
| Belfast East
|
|
Alliance
|
|
DUP gain
|
| Bermondsey and Old Southwark
|
|
Liberal Democrats
|
|
Labour gain
|
| Berwick-upon-Tweed
|
|
Liberal Democrats
|
|
Conservative gain
|
| Berwickshire, Roxburgh and Selkirk
|
|
Liberal Democrats
|
|
SNP gain
|
| Birmingham, Yardley
|
|
Liberal Democrats
|
|
Labour gain
|
| Bolton West
|
|
Labour
|
|
Conservative gain
|
| Bradford East
|
|
Liberal Democrats
|
|
Labour gain
|
| Brecon and Radnorshire
|
|
Liberal Democrats
|
|
Conservative gain
|
| Brent Central
|
|
Liberal Democrats
|
|
Labour gain
|
| Brentford and Isleworth
|
|
Conservative
|
|
Labour gain
|
| Bristol West
|
|
Liberal Democrats
|
|
Labour gain
|
| Burnley
|
|
Liberal Democrats
|
|
Labour gain
|
| Caithness, Sutherland and Easter Ross
|
|
Liberal Democrats
|
|
SNP gain
|
| Cambridge
|
|
Liberal Democrats
|
|
Labour gain
|
| Cardiff Central
|
|
Liberal Democrats
|
|
Labour gain
|
| Central Ayrshire
|
|
Labour
|
|
SNP gain
|
| Cheadle
|
|
Liberal Democrats
|
|
Conservative gain
|
| Cheltenham
|
|
Liberal Democrats
|
|
Conservative gain
|
| Chippenham
|
|
Liberal Democrats
|
|
Conservative gain
|
| City of Chester
|
|
Conservative
|
|
Labour gain
|
| Clacton
|
|
Conservative
|
|
UKIP gain
|
| Coatbridge, Chryston and Bellshill
|
|
Labour
|
|
SNP gain
|
| Colchester
|
|
Liberal Democrats
|
|
Conservative gain
|
| Cumbernauld, Kilsyth and Kirkintilloch East
|
|
Labour
|
|
SNP gain
|
| Derby North
|
|
Labour
|
|
Conservative gain
|
| Dewsbury
|
|
Conservative
|
|
Labour gain
|
| Dumfries and Galloway
|
|
Labour
|
|
SNP gain
|
| Dundee West
|
|
Labour
|
|
SNP gain
|
| Dunfermline and West Fife
|
|
Labour
|
|
SNP gain
|
| Ealing Central and Acton
|
|
Conservative
|
|
Labour gain
|
| East Dunbartonshire
|
|
Liberal Democrats
|
|
SNP gain
|
| East Kilbride, Strathaven and Lesmahagow
|
|
Labour
|
|
SNP gain
|
| East Lothian
|
|
Labour
|
|
SNP gain
|
| East Renfrewshire
|
|
Labour
|
|
SNP gain
|
| Eastbourne
|
|
Liberal Democrats
|
|
Conservative gain
|
| Eastleigh
|
|
Liberal Democrats
|
|
Conservative gain
|
| Edinburgh East
|
|
Labour
|
|
SNP gain
|
| Edinburgh North and Leith
|
|
Labour Co-op
|
|
SNP gain
|
| Edinburgh South West
|
|
Labour
|
|
SNP gain
|
| Edinburgh West
|
|
Liberal Democrats
|
|
SNP gain
|
| Enfield North
|
|
Conservative
|
|
Labour gain
|
| Falkirk
|
|
Labour
|
|
SNP gain
|
| Fermanagh and South Tyrone
|
|
Sinn Féin
|
|
UUP gain
|
| Glasgow Central
|
|
Labour
|
|
SNP gain
|
| Glasgow East
|
|
Labour
|
|
SNP gain
|
| Glasgow North
|
|
Labour
|
|
SNP gain
|
| Glasgow North East
|
|
Labour
|
|
SNP gain
|
| Glasgow North West
|
|
Labour
|
|
SNP gain
|
| Glasgow South
|
|
Labour
|
|
SNP gain
|
| Glasgow South West
|
|
Labour Co-op
|
|
SNP gain
|
| Glenrothes
|
|
Labour
|
|
SNP gain
|
| Gordon
|
|
Liberal Democrats
|
|
SNP gain
|
| Gower
|
|
Labour
|
|
Conservative gain
|
| Hazel Grove
|
|
Liberal Democrats
|
|
Conservative gain
|
| Hornsey and Wood Green
|
|
Liberal Democrats
|
|
Labour gain
|
| Hove
|
|
Conservative
|
|
Labour gain
|
| Ilford North
|
|
Conservative
|
|
Labour gain
|
| Inverclyde
|
|
Labour
|
|
SNP gain
|
| Inverness, Nairn, Badenoch and Strathspey
|
|
Liberal Democrats
|
|
SNP gain
|
| Kilmarnock and Loudoun
|
|
Labour Co-op
|
|
SNP gain
|
| Kingston and Surbiton
|
|
Liberal Democrats
|
|
Conservative gain
|
| Kirkcaldy and Cowdenbeath
|
|
Labour
|
|
SNP gain
|
| Lanark and Hamilton East
|
|
Labour
|
|
SNP gain
|
| Lancaster and Fleetwood
|
|
Conservative
|
|
Labour gain
|
| Lewes
|
|
Liberal Democrats
|
|
Conservative gain
|
| Linlithgow and East Falkirk
|
|
Labour
|
|
SNP gain
|
| Livingston
|
|
Labour
|
|
SNP gain
|
| Manchester Withington
|
|
Liberal Democrats
|
|
Labour gain
|
| Mid Dorset and North Poole
|
|
Liberal Democrats
|
|
Conservative gain
|
| Midlothian
|
|
Labour
|
|
SNP gain
|
| Morley and Outwood
|
|
Labour Co-op
|
|
Conservative gain
|
| Motherwell and Wishaw
|
|
Labour
|
|
SNP gain
|
| North Ayrshire and Arran
|
|
Labour
|
|
SNP gain
|
| North Cornwall
|
|
Liberal Democrats
|
|
Conservative gain
|
| North Devon
|
|
Liberal Democrats
|
|
Conservative gain
|
| North East Fife
|
|
Liberal Democrats
|
|
SNP gain
|
| Norwich South
|
|
Liberal Democrats
|
|
Labour gain
|
| Ochil and Perthshire South
|
|
Labour
|
|
SNP gain
|
| Paisley and Renfrewshire North
|
|
Labour
|
|
SNP gain
|
| Paisley and Renfrewshire South
|
|
Labour
|
|
SNP gain
|
| Plymouth Moorview
|
|
Labour
|
|
Conservative gain
|
| Portsmouth South
|
|
Liberal Democrats
|
|
Conservative gain
|
| Redcar
|
|
Liberal Democrats
|
|
Labour gain
|
| Ross, Skye and Lochaber
|
|
Liberal Democrats
|
|
SNP gain
|
| Rutherglen and Hamilton West
|
|
Labour
|
|
SNP gain
|
| St Austell and Newquay
|
|
Liberal Democrats
|
|
Conservative gain
|
| St Ives
|
|
Liberal Democrats
|
|
Conservative gain
|
| Solihull
|
|
Liberal Democrats
|
|
Conservative gain
|
| Somerton and Frome
|
|
Liberal Democrats
|
|
Conservative gain
|
| South Antrim
|
|
DUP
|
|
UUP gain
|
| Southampton Itchen
|
|
Labour
|
|
Conservative gain
|
| Stirling
|
|
Labour
|
|
SNP gain
|
| Sutton and Cheam
|
|
Liberal Democrats
|
|
Conservative gain
|
| Taunton Deane
|
|
Liberal Democrats
|
|
Conservative gain
|
| Telford
|
|
Labour
|
|
Conservative gain
|
| Thornbury and Yate
|
|
Liberal Democrats
|
|
Conservative gain
|
| Torbay
|
|
Liberal Democrats
|
|
Conservative gain
|
| Twickenham
|
|
Liberal Democrats
|
|
Conservative gain
|
| Vale of Clwyd
|
|
Labour
|
|
Conservative gain
|
| Wells
|
|
Liberal Democrats
|
|
Conservative gain
|
| West Dunbartonshire
|
|
Labour
|
|
SNP gain
|
| Wirral West
|
|
Conservative
|
|
Labour gain
|
| Wolverhampton South West
|
|
Conservative
|
|
Labour gain
|
| Yeovil
|
|
Liberal Democrats
|
|
Conservative gain
|
England
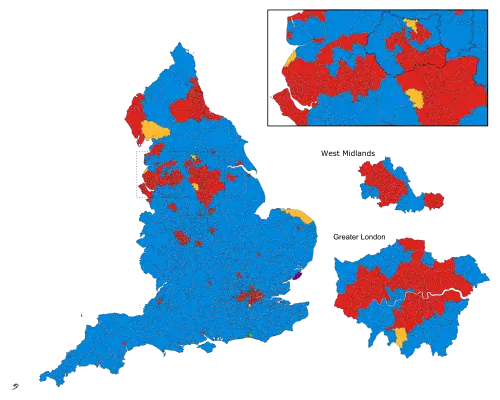
East of England
East Midlands
London
North East
North West
South East
South West
West Midlands
Yorkshire and the Humber
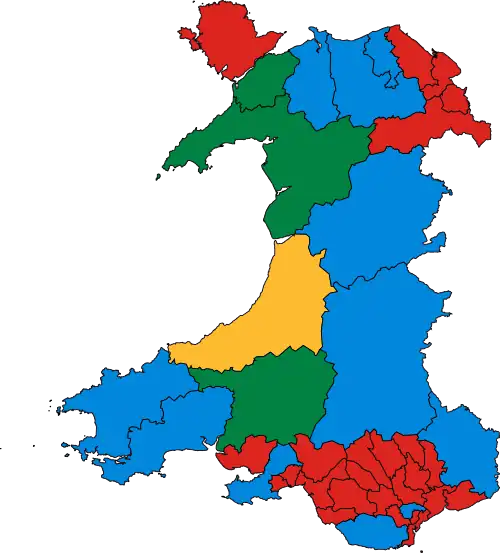
Wales
Scotland
.svg.png)
Northern Ireland
.svg.png)
References
Election results in the United Kingdom |
|---|
| Election results by year | |
|---|
| General election results by region | |
|---|
| Non general elections | |
|---|
| Referendums | |
|---|
| Other | |
|---|
Template:UK election results |