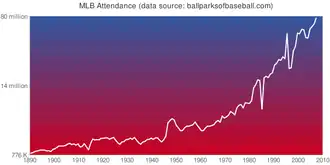
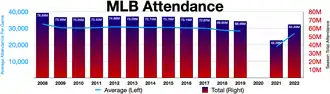
Attendance for all teams 1890–2008 (updated) MLB attendance 2008-2022 Total attendance for the season (right)
Average attendance per game (left)
Most attended game in history
The all-time attendance record of 115,300 was set at a preseason game between the defending champions Boston Red Sox and Los Angeles Dodgers on March 29, 2008, at the Los Angeles Memorial Coliseum .[ 1] [ 2] National Baseball Hall of Fame , this is the only baseball game where the 100,000 figure has been definitively exceeded.[ 3] [ a]
Least attended game in history
The record was set on September 28, 1882, in game between the Troy Trojans and the Worcesters in Worcester, Massachusetts, which some reports had only six spectators attend. As both clubs had been notified that they were being dropped from the National League, fans had very little interest in watching the lame-duck teams,[ 4] Boston Globe [ 5]
This record does not count games played behind closed doors by governmental authority. Games that were played as such included the April 29, 2015 game between the Baltimore Orioles and the Chicago White Sox at Oriole Park at Camden Yards , which was closed because of safety concerns surrounding the 2015 Baltimore protests ,[ 6] COVID-19 pandemic in 2020.
The following shows the highest and lowest season home totals by team since 1903, excluding the 1918 , 1981 , 2020 , and 2021 seasons.
Team name
Season
Highest attendance
Per game average
Ballpark
Season
Lowest attendance
Per game average
Ballpark
Arizona Diamondbacks [ 7] 1998
3,610,290
44,571
Bank One Ballpark
2016
2,036,216
25,138
Chase Field
Atlanta Braves [ 8] 1993
3,884,720
47,960
Atlanta–Fulton County Stadium
1911
116,000
1,547
South End Grounds III
Baltimore Orioles [ 9] 1997
3,711,132
45,816
Oriole Park at Camden Yards
1935
80,922
1,065
Sportsman's Park III
Boston Red Sox [ 10] 2009
3,062,699
37,811
Fenway Park
1932
182,150
2,366
Fenway Park and Braves Field
Chicago Cubs [ 11] 2008
3,300,200
40,743
Wrigley Field
1914
202,516
2,665
West Side Grounds
Chicago White Sox [ 12] 2006
2,957,414
36,511
U.S. Cellular Field
1932
233,198
3,029
Comiskey Park I
Cincinnati Reds [ 13] 1976
2,629,708
32,466
Riverfront Stadium
1914
100,791
1,309
Redland Field
Cleveland Guardians [ 14] 1999
3,468,456
42,820
Jacobs Field
1915
159,285
2,069
League Park II
Colorado Rockies [ 15] 1993
4,483,350
55,350
Mile High Stadium
2005
1,914,389
23,634
Coors Field
Detroit Tigers [ 16] 2008
3,202,645
39,539
Comerica Park
1906
174,043
2,231
Bennett Park
Houston Astros [ 17] 2004
3,087,872
38,122
Minute Maid Park
1963
719,502
8,883
Colt Stadium
Kansas City Royals [ 18] 2015
2,708,549
33,439
Kauffman Stadium
1970
693,047
8,773
Municipal Stadium
Los Angeles Angels [ 19] 2006
3,406,790
42,059
Angel Stadium of Anaheim
1965
566,727
7,064
Dodger Stadium
Los Angeles Dodgers [ 20] 2019
3,974,309
49,066
Dodger Stadium
1914
122,671
1,553
Ebbets Field
Miami Marlins [ 21] 1993
3,064,847
37,838
Joe Robbie Stadium
2018
811,104
10,014
Marlins Park
Milwaukee Brewers [ 22] 2011
3,071,373
37,918
Miller Park
1972
600,440
7,601
County Stadium
Minnesota Twins [ 23] 2010
3,223,640
39,798
Target Field
1903
128,878
1,815
American League Park I
New York Mets [ 24] 2008
4,042,045
49,902
Shea Stadium
1979
788,905
9,621
Shea Stadium
New York Yankees [ 25] 2008
4,298,655
53,070
Yankee Stadium
1903
211,808
3,161
Hilltop Park
Oakland Athletics [ 26] 1990
2,900,217
35,805
Oakland Coliseum
1915
146,223
1,976
Shibe Park
Philadelphia Phillies [ 27] [ 28] [ 29] [ 30] [ 31] 2011
3,680,718
45,440
Citizens Bank Park
1914
138,474
1,775
Baker Bowl
Pittsburgh Pirates [ 32] 2015
2,498,596
30,847
PNC Park
1914
139,620
1,813
Forbes Field
Seattle Mariners [ 33] 2002
3,542,938
43,740
Safeco Field
1983
813,537
10,044
Kingdome
St. Louis Cardinals [ 34] 2007
3,552,180
43,854
Busch Stadium
1919
167,059
2,421
Robison Field
San Diego Padres [ 35] 2024
3,330,545
41,117
Petco Park
1969
512,970
6,333
San Diego Stadium
San Francisco Giants [ 36] 2011
3,387,303
41,819
AT&T Park
1914
364,313
4,554
Polo Grounds V
Tampa Bay Rays [ 37] 1998
2,506,293
30,942
Tropicana Field
2003
1,058,695
13,070
Tropicana Field
Texas Rangers [ 38] 2012
3,460,280
42,720
The Ballpark in Arlington
1963
535,604
6,695
D.C. Stadium
Toronto Blue Jays [ 39] 1993
4,057,947
50,098
SkyDome
1982
1,275,978
15,753
Exhibition Stadium
Washington Nationals [ 40] 2005
2,731,993
33,728
R.F.K. Stadium
2001
642,745
7,935
Olympic Stadium
The highest per game attendance average is held by the Colorado Rockies in 1994 with 57,570 for 57 home games at Mile High Stadium during the strike shortened season.
The 1918 season is excluded as it was shortened due to travel restrictions caused by World War I .
The 1981 season is excluded due to the players' strike that cancelled almost two months' worth of games.
The 2020 and 2021 seasons are excluded due to the COVID-19 pandemic that caused restrictions on public gatherings.
4 million or more home attendance totals
Toronto Blue Jays became the first team in baseball history to draw 4 million mark in attendance in 1991 season.[ 41]
Team name
Season
Home attendance
Per game
Ballpark
Colorado Rockies [ 15] 1993
4,483,350
55,350
Mile High Stadium
New York Yankees [ 25] 2008
4,298,655
53,070
Yankee Stadium
New York Yankees [ 25] 2007
4,271,867
52,739
Yankee Stadium
New York Yankees [ 25] 2006
4,248,067
52,445
Yankee Stadium
New York Yankees [ 25] 2005
4,090,696
50,502
Yankee Stadium
Toronto Blue Jays [ 39] 1993
4,057,947
50,098
SkyDome
New York Mets [ 24] 2008
4,042,045
49,902
Shea Stadium
Toronto Blue Jays [ 39] 1992
4,028,318
49,732
SkyDome
Toronto Blue Jays [ 39] 1991
4,001,527
49,402
SkyDome
Progression of home field attendance record
Season
Team
Home attendance
Per game
Ballpark
1993
Colorado Rockies [ 42] 4,483,350
55,350
Mile High Stadium
1992
Toronto Blue Jays [ 41] 4,028,318
49,732
SkyDome
1991
Toronto Blue Jays [ 41] 4,001,527
49,402
SkyDome
1990
Toronto Blue Jays [ 41] 3,885,284
47,966
SkyDome
1982
Los Angeles Dodgers [ 41] 3,608,881
44,554
Dodger Stadium
1978
Los Angeles Dodgers [ 43] 3,347,845
41,331
Dodger Stadium
1977
Los Angeles Dodgers
2,955,087
36,483
Dodger Stadium
1962
Los Angeles Dodgers [ 44] 2,755,184
33,195
Dodger Stadium
1948
Cleveland Indians [ 44] 2,620,627
33,172
Cleveland Stadium
1946
New York Yankees [ 45] 2,265,512
29,422
Yankee Stadium
1929
Chicago Cubs [ 46] 1,485,166
19,041
Wrigley Field
1920
New York Yankees [ 45] 1,289,422
16,746
Polo Grounds IV
1908
New York Giants [ 47] 910,000
11,375
Polo Grounds III
1905
Chicago White Sox
687,419
8,383
South Side Park II
1904
Boston Americans
623,295
7,695
Huntington Avenue Grounds
1903
New York Giants [ 47] 579,530
8,279
Polo Grounds III
1895
Philadelphia Phillies [ 48] 474,971
7,142
Baker Bowl
1894
New York Giants [ 47] 387,000
5,650
Polo Grounds III
1888
New York Giants [ 47] 305,455
4,663
Polo Grounds II
1887
New York Giants [ 47] 270,945
4,406
Polo Grounds II
1883
St. Louis Browns (AA) [ 49] 243,000
4,959
South End Grounds
Highest and lowest attendance by season
Season
Team With Highest Attendance
High Attendance
Team With Lowest Attendance
Low Attendance
2024
Los Angeles Dodgers [ 50] 3,941,521
Oakland Athletics
922,286
2023
Los Angeles Dodgers [ 50] 3,837,079
Oakland Athletics
832,352
2022
Los Angeles Dodgers [ 51] 3,861,408
Oakland Athletics
787,902
2021
Los Angeles Dodgers [ 52] 2,804,693
Miami Marlins
642,617
2020 [ b]
Los Angeles Dodgers
77,407
Atlanta Braves
32,827
2019
Los Angeles Dodgers [ 20] 3,974,309
Miami Marlins [ 21] 811,302
2018
Los Angeles Dodgers [ 20] 3,857,500
Miami Marlins [ 21] 811,104
2017
Los Angeles Dodgers [ 20] 3,765,856
Tampa Bay Rays [ 37] 1,253,619
2016
Los Angeles Dodgers [ 20] 3,703,312
Tampa Bay Rays [ 37] 1,286,163
2015
Los Angeles Dodgers [ 20] 3,764,815
Tampa Bay Rays [ 37] 1,287,054
2014
Los Angeles Dodgers [ 20] 3,782,337
Cleveland Indians [ 14] 1,437,393
2013
Los Angeles Dodgers [ 20] 3,743,527
Tampa Bay Rays [ 37] 1,510,300
2012
Philadelphia Phillies [ 26] 3,565,718
Tampa Bay Rays [ 37] 1,559,681
2011
Philadelphia Phillies [ 26] 3,680,718
Oakland Athletics [ 26] 1,476,791
2010
Philadelphia Phillies [ 26] 3,777,322
Cleveland Indians [ 14] 1,391,644
2009
Los Angeles Dodgers [ 20] 3,761,655
Oakland Athletics [ 26] 1,408,783
2008
New York Yankees [ 25] 4,298,655
Florida Marlins [ 21] 1,335,076
2007
New York Yankees [ 25] 4,271,083
Florida Marlins [ 21] 1,370,511
2006
New York Yankees [ 25] 4,248,067
Florida Marlins [ 21] 1,164,134
2005
New York Yankees [ 25] 4,090,696
Tampa Bay Devil Rays [ 37] 1,141,669
2004
New York Yankees [ 25] 3,775,292
Montreal Expos [ 40] 749,550
2003
New York Yankees [ 25] 3,465,600
Montreal Expos [ 40] 1,025,639
2002
Seattle Mariners [ 33] 3,542,938
Montreal Expos [ 40] 812,045
2001
Seattle Mariners [ 33] 3,507,326
Montreal Expos [ 40] 642,745
2000
Cleveland Indians [ 14] 3,456,278
Montreal Expos [ 40] 926,272
1999
Colorado Rockies [ 15] 3,481,065
Montreal Expos [ 40] 773,277
1998
Colorado Rockies [ 15] 3,792,683
Montreal Expos [ 40] 914,909
1997
Colorado Rockies [ 15] 3,888,453
Oakland Athletics [ 26] 1,264,218
1996
Colorado Rockies [ 15] 3,891,014
Oakland Athletics [ 26] 1,148,380
1995
Colorado Rockies [ 15] 3,390,037
Pittsburgh Pirates [ 32] 905,517
1994
Colorado Rockies [ 15] 3,281,511
San Diego Padres [ 35] 953,857
1993
Colorado Rockies [ 15] 4,483,350
San Diego Padres
1,375,432
1992
Toronto Blue Jays [ 39] 4,028,318
Houston Astros [ 17] 1,211,412
1991
Toronto Blue Jays [ 39] 4,001,527
Montreal Expos [ 40] 934,742
1990
Toronto Blue Jays [ 39] 3,885,284
Atlanta Braves [ 8] 980,129
1989
Toronto Blue Jays [ 39] 3,375,883
Atlanta Braves [ 8] 984,930
1988
New York Mets [ 24] 3,055,445
Atlanta Braves [ 8] 848,089
1987
St. Louis Cardinals [ 34] 3,072,122
Cleveland Indians [ 14] 1,077,898
1986
Los Angeles Dodgers [ 20] 3,023,208
Pittsburgh Pirates [ 32] 1,000,917
1985
Los Angeles Dodgers [ 20] 3,264,593
Cleveland Indians [ 14] 655,181
1984
Los Angeles Dodgers [ 20] 3,134,824
Cleveland Indians [ 14] 734,079
1983
Los Angeles Dodgers [ 20] 3,510,313
Cleveland Indians [ 14] 768,941
1982
Los Angeles Dodgers [ 20] 3,608,881
Minnesota Twins [ 53] 921,186
1981
Los Angeles Dodgers [ 20] 2,381,292
Minnesota Twins [ 53] 469,090
1980
Los Angeles Dodgers [ 20] 3,249,287
Minnesota Twins [ 53] 769,206
1979
Los Angeles Dodgers [ 20] 2,860,954
Oakland Athletics [ 26] 306,763
1978
Los Angeles Dodgers [ 20] 3,347,845
Oakland Athletics [ 26] 526,999
1977
Los Angeles Dodgers [ 20] 2,955,087
Oakland Athletics [ 26] 495,599
1976
Cincinnati Reds [ 13] 2,629,708
San Francisco Giants [ 36] 626,868
1975
Los Angeles Dodgers [ 20] 2,539,349
San Francisco Giants [ 36] 522,919
1974
Los Angeles Dodgers [ 20] 2,632,474
San Francisco Giants [ 36] 519,987
1973
Los Angeles Dodgers [ 20] 2,136,192
San Diego Padres [ 35] 611,826
1972
New York Mets [ 24] 2,134,185
Milwaukee Brewers [ 22] 600,440
1971
New York Mets [ 24] 2,266,680
San Diego Padres [ 35] 557,513
1970
New York Mets [ 24] 2,697,479
Chicago White Sox [ 12] 495,355
1969
New York Mets [ 24] 2,175,373
San Diego Padres [ 35] 512,970
1968
Detroit Tigers [ 16] 2,031,847
Washington Senators [ 38] 546,661
1967
St. Louis Cardinals [ 34] 2,090,145
Cleveland Indians [ 14] 662,980
1966
Los Angeles Dodgers [ 20] 2,617,029
Washington Senators [ 38] 576,260
1965
Los Angeles Dodgers [ 20] 2,553,577
Kansas City Athletics [ 26] 528,344
1964
Los Angeles Dodgers [ 26] 2,228,751
Washington Senators [ 38] 600,106
1963
Los Angeles Dodgers [ 20] 2,538,602
Washington Senators [ 38] 535,604
1962
Los Angeles Dodgers [ 20] 2,755,184
Chicago Cubs [ 11] 609,802
1961
Los Angeles Dodgers [ 20] 1,804,250
Philadelphia Phillies [ 26] 590,039
1960
Los Angeles Dodgers [ 20] 2,253,887
Cincinnati Reds [ 13] 663,486
1959
Los Angeles Dodgers [ 20] 2,071,045
Washington Senators [ 53] 615,372
1958
Milwaukee Braves [ 8] 1,971,101
Washington Senators [ 53] 475,288
1957
Milwaukee Braves [ 8] 2,215,404
Washington Senators [ 53] 457,079
1956
Milwaukee Braves [ 8] 2,046,331
Washington Senators [ 53] 431,647
1955
Milwaukee Braves [ 8] 2,005,836
Washington Senators [ 53] 425,238
1954
Milwaukee Braves [ 8] 2,131,388
Philadelphia Athletics [ 26] 304,666
1953
Milwaukee Braves [ 8] 1,826,397
St. Louis Browns [ 9] 297,238
1952
New York Yankees [ 25] 1,629,665
Boston Braves [ 8] 281,278
1951
New York Yankees [ 8] 1,950,107
St. Louis Browns [ 9] 293,790
1950
New York Yankees [ 25] 2,081,380
St. Louis Browns [ 9] 247,131
1949
New York Yankees [ 25] 2,283,676
St. Louis Browns [ 9] 270,936
1948
Cleveland Indians [ 14] 2,620,627
St. Louis Browns [ 9] 335,564
1947
New York Yankees [ 25] 2,178,937
St. Louis Browns [ 9] 320,474
1946
New York Yankees [ 25] 2,265,512
St. Louis Browns [ 9] 526,435
1945
Detroit Tigers [ 16] 1,280,341
Philadelphia Phillies [ 26] 285,057
1944
Detroit Tigers [ 16] 923,176
Boston Braves [ 8] 208,691
1943
Brooklyn Dodgers [ 20] 661,739
St. Louis Browns [ 9] 214,392
1942
Brooklyn Dodgers [ 20] 1,037,765
Philadelphia Phillies [ 26] 230,183
1941
Brooklyn Dodgers [ 20] 1,214,910
St. Louis Browns [ 9] 176,240
1940
Detroit Tigers [ 16] 1,112,693
Philadelphia Phillies [ 26] 207,177
1939
Cincinnati Reds [ 13] 981,443
St. Louis Browns [ 9] 109,159
1938
New York Yankees [ 25] 970,916
St. Louis Browns [ 9] 130,417
1937
Detroit Tigers [ 16] 1,072,276
St. Louis Browns [ 9] 123,121
1936
New York Yankees [ 25] 976,913
St. Louis Browns [ 9] 93,267
1935
Detroit Tigers [ 16] 1,034,929
St. Louis Browns [ 9] 80,922
1934
Detroit Tigers [ 16] 919,161
St. Louis Browns [ 9] 115,305
1933
New York Yankees [ 25] 728,014
St. Louis Browns [ 9] 88,113
1932
Chicago Cubs [ 11] 974,688
St. Louis Browns [ 9] 112,558
1931
Chicago Cubs [ 11] 1,086,422
St. Louis Browns [ 9] 179,126
1930
Chicago Cubs [ 11] 1,463,624
St. Louis Browns [ 9] 152,088
1929
Chicago Cubs [ 11] 1,485,166
St. Louis Browns [ 9] 280,697
1928
Chicago Cubs [ 11] 1,143,740
Philadelphia Phillies [ 26] 182,168
1927
New York Yankees [ 25] 1,164,015
St. Louis Browns [ 9] 247,879
1926
New York Yankees [ 25] 1,027,675
Philadelphia Phillies [ 26] 240,600
1925
Philadelphia Athletics [ 26] 869,703
Boston Red Sox [ 10] 267,782
1924
New York Yankees [ 25] 1,053,533
Boston Braves [ 8] 177,478
1923
New York Yankees [ 25] 1,007,066
Boston Braves [ 8] 227,802
1922
New York Yankees [ 25] 1,026,134
Boston Braves [ 8] 167,965
1921
New York Yankees [ 25] 1,230,696
Philadelphia Phillies [ 26] 273,961
Largest crowds at a World Series game
Attendance
Opponents
Game number
Date
Stadium
Ref.
92,706
Chicago White Sox at Los Angeles Dodgers
Game 5
October 6, 1959
Los Angeles Memorial Coliseum
[ 54]
92,650
Chicago White Sox at Los Angeles Dodgers
Game 4
October 5, 1959
Los Angeles Memorial Coliseum
[ 55]
92,394
Chicago White Sox at Los Angeles Dodgers
Game 3
October 4, 1959
Los Angeles Memorial Coliseum
[ 56]
86,288
Boston Braves at Cleveland Indians
Game 5
October 10, 1948
Cleveland Stadium
[ 57]
81,897
Boston Braves at Cleveland Indians
Game 4
October 9, 1948
Cleveland Stadium
[ 58]
78,102
New York Giants at Cleveland Indians
Game 4
October 2, 1954
Cleveland Stadium
[ 59]
74,065
Brooklyn Dodgers at New York Yankees
Game 6
October 5, 1947
Yankee Stadium
[ 60]
73,977
Brooklyn Dodgers at New York Yankees
Game 3
October 6, 1956
Yankee Stadium
[ 61]
73,365
Brooklyn Dodgers at New York Yankees
Game 1
September 30, 1947
Yankee Stadium
[ 62]
71,787
Brooklyn Dodgers at New York Yankees
Game 4
October 4, 1952
Yankee Stadium
[ 63]
67,498
Cleveland Indians at Florida Marlins
Game 6
October 25, 1997
Pro Player Stadium
[ 64]
Notes
^ Other games thought to have exceeded 100,000 spectators include two amateur games at Cleveland's Brookside Park , on September 20, 1914 and October 12, 1915, and two exhibition games at the 1936 and 1956 Summer Olympics . However, none of the four claims are considered provable or definitively supported by hard evidence.[ 3]
^ All games with paid attendance were played at Globe Life Field in Arlington, Texas, based on MLB standards for games with listed team as home team for playoff games. Only three teams played with paid attendance (Atlanta Braves in NLCS and Tampa Bay Rays , which had 34,325 attendance in the World Series games as the designated home team). 27 teams played all games behind closed doors under MLB regulations because of COVID-19. Only the National League Championship Series and World Series were played with spectators.
References
^ Shaikin, Bill (March 30, 2008). "Baseball from another dimension" . Los Angeles Times . Retrieved June 4, 2024 . ^ "Record crowd watches Dodgers v Red Sox exhibition" . Reuters Archived from the original on 2023-04-10.^ a b Jim Gates. "Clicking Turnstiles" . National Baseball Hall of Fame. Retrieved 20 November 2023 . ^ Encina, Eduardo A. (April 29, 2015). "Taking a look back at baseball's lowest attended game before today" . Baltimore Sun the original on March 6, 2016. Retrieved June 4, 2024 . ^ "Troys, 4; Worcesters, 1" . The Boston Globe . Retrieved June 4, 2024 – via Newspapers.com .^ "Orioles defeat White Sox at Camden Yards with no fans in attendance" . ESPN.com . Associated Press. April 29, 2015. Retrieved 2025-07-09 .^ "Arizona Diamondbacks Attendance, Stadiums and Park Factors" . Baseball-Reference.com . Retrieved 2009-01-30 .^ a b c d e f g h i j k l m n o p "Atlanta Braves Attendance, Stadiums and Park Factors" . Baseball-Reference.com . Retrieved 2020-09-08 .^ a b c d e f g h i j k l m n o p q r s t u v "Baltimore Orioles Attendance, Stadiums and Park Factors" . Baseball-Reference.com . Retrieved 2020-09-08 .^ a b "Boston Red Sox Attendance, Stadiums and Park Factors" . Baseball-Reference.com . Retrieved 2020-09-08 .^ a b c d e f g "Chicago Cubs Attendance, Stadiums and Park Factors" . Baseball-Reference.com . Retrieved 2020-09-08 .^ a b "Chicago White Sox Attendance, Stadiums and Park Factors" . Baseball-Reference.com . Retrieved 2020-09-08 .^ a b c d "Cincinnati Reds Attendance, Stadiums and Park Factors" . Baseball-Reference.com . Retrieved 2020-09-08 .^ a b c d e f g h i j "Cleveland Indians Attendance, Stadiums and Park Factors" . Baseball-Reference.com . Retrieved 2020-09-08 .^ a b c d e f g h i "Colorado Rockies Attendance, Stadiums and Park Factors" . Baseball-Reference.com . Retrieved 2020-09-08 .^ a b c d e f g h "Detroit Tigers Attendance, Stadiums and Park Factors" . Baseball-Reference.com . Retrieved 2020-09-08 .^ a b "Houston Astros Attendance, Stadiums and Park Factors" . Baseball-Reference.com . Retrieved 2020-09-08 .^ "Kansas City Royals Attendance, Stadiums and Park Factors" . Baseball-Reference.com . Retrieved 2009-01-30 .^ "Los Angeles Angels Attendance, Stadiums and Park Factors" . Baseball-Reference.com . Retrieved 2009-01-30 .^ a b c d e f g h i j k l m n o p q r s t u v w x y z aa ab ac ad ae af "Los Angeles Dodgers Attendance, Stadiums and Park Factors" . Baseball-Reference.com . Retrieved 2020-09-08 .^ a b c d e f "Florida Marlins Attendance, Stadiums and Park Factors" . Baseball-Reference.com . Retrieved 2020-09-08 .^ a b "Milwaukee Brewers Attendance, Stadiums and Park Factors" . Baseball-Reference.com . Retrieved 2020-09-08 .^ "AL/2010-misc" . Baseball-Reference.com . Retrieved 2010-10-04 .^ a b c d e f g "New York Mets Attendance, Stadiums and Park Factors" . Baseball-Reference.com . Retrieved 2020-09-08 .^ a b c d e f g h i j k l m n o p q r s t u v w x y "New York Yankees Attendance, Stadiums and Park Factors" . Baseball-Reference.com . Retrieved 2020-09-08 .^ a b c d e f g h i j k l m n o p q r s t u v "Oakland Athletics Attendance, Stadiums and Park Factors" . Baseball-Reference.com . Retrieved 2020-09-08 .^ "Attendance up by under 1 percent" . ESPN. Associated Press. September 29, 2011. Retrieved 2011-09-30 . The ... Phillies led baseball's attendance chart for the first time .... ^ "Baseball attendance increased from 2010" . Yahoo! Sports . The Sports Xchange. September 29, 2011. Retrieved 2011-09-30 .^ "Philadelphia Phillies Lead MLB in Attendance For First Time Ever" . RantSports. September 29, 2011. Archived from the original on June 13, 2013. Retrieved 2011-09-30 .^ "Phillies set attendance record" . Philadelphia Business Journal . American City Business Journals, Inc. September 23, 2011. Retrieved 2011-09-30 .^ "2010 National League Attendance & Miscellaneous" . Baseball-Reference.com . Retrieved 2010-10-04 .^ a b c "Pittsburgh Pirates Attendance, Stadiums and Park Factors" . Baseball-Reference.com . Retrieved 2020-09-08 .^ a b c "Seattle Mariners Attendance, Stadiums and Park Factors" . Baseball-Reference.com . Retrieved 2020-09-08 .^ a b c "St. Louis Cardinals Attendance, Stadiums and Park Factors" . Baseball-Reference.com . Retrieved 2020-09-08 .^ a b c d e "San Diego Padres Attendance, Stadiums and Park Factors" . Baseball-Reference.com . Retrieved 2020-09-08 .^ a b c d "San Francisco Giants Attendance, Stadiums and Park Factors" . Baseball-Reference.com . Retrieved 2020-09-13 .^ a b c d e f g "Tampa Bay Rays Attendance, Stadiums and Park Factors" . Baseball-Reference.com . Retrieved 2020-09-08 .^ a b c d e "Texas Rangers Attendance, Stadiums and Park Factors" . Baseball-Reference.com . Retrieved 2020-09-08 .^ a b c d e f g h "Toronto Blue Jays Attendance, Stadiums and Park Factors" . Baseball-Reference.com . Retrieved 2020-09-08 .^ a b c d e f g h i "Washington Nationals Attendance, Stadiums and Park Factors" . Baseball-Reference.com . Retrieved 2020-09-08 .^ a b c d e "Blue Jays timeline (1990–1999)" . Toronto Blue Jays . MLB. Archived from the original on June 3, 2007. Retrieved 2009-01-31 .^ "Rockies timeline (1990–1994)" . Colorado Rockies . MLB. Archived from the original on 2011-09-27. Retrieved 2009-01-31 .^ "Dodgers timeline (1970s)" . The Official Site of The Los Angeles Dodgers . Archived from the original on April 20, 2007. Retrieved 2009-01-31 .^ a b "Cleveland Indians" . Baseball Almanac. Retrieved 2009-01-31 .^ a b "New York Yankees Attendance Records" . Baseball Almanac. Retrieved 2009-01-31 .^ "Chicago Cubs Attendance Records" . Baseball Almanac. Retrieved 2019-08-02 .^ a b c d e "Attendance Records for the San Francisco Giants" . Retrieved 2020-09-13 .^ "Attendance Records for the Philadelphia Phillies" . Retrieved 2020-09-13 .^ "Attendance Records for the St. Louis Cardinals" . Retrieved 2020-09-13 .^ a b "2024 Major League Baseball Attendance & Team Age" .^ "2022 Major League Baseball Attendance & Team Age" .^ "2021 Major League Baseball Attendance & Team Age" .^ a b c d e f g h "Minnesota Twins Attendance, Stadiums and Park Factors" . Baseball-Reference.com . Retrieved 2020-09-08 .^ "1959 World Series Game 5, White Sox at Dodgers, October 6" . Baseball-Reference.com .^ "1959 World Series Game 4, White Sox at Dodgers, October 5" . Baseball-Reference.com .^ "1959 World Series Game 3, White Sox at Dodgers, October 4" . Baseball-Reference.com .^ "1948 World Series Game 5, Braves at Indians, October 10" . Baseball-Reference.com .^ "1948 World Series Game 4, Braves at Indians, October 9" . Baseball-Reference.com .^ "1954 World Series Game 4, Giants at Indians, October 2" . Baseball-Reference.com .^ "1947 World Series Game 6, Dodgers at Yankees, October 5" . Baseball-Reference.com .^ "1956 World Series Game 3, Dodgers at Yankees, October 6" . Baseball-Reference.com .^ "1947 World Series Game 1, Dodgers at Yankees, September 30" . Baseball-Reference.com .^ "1952 World Series Game 4, Dodgers at Yankees, October 4" . Baseball-Reference.com .^ "1997 World Series Game 6, Indians at Marlins, October 25" . Baseball-Reference.com .
General Batting
Career Annual Season Game Misc
Baserunning
Pitching
Career Annual Season Game Misc
Fielding
Managing Multiple stat Other