Machado, Minas Gerais
Machado, Minas Gerais | |
|---|---|
Municipality | |
 Bridge connecting Cordislândia-MG to Machado-MG | |
 Flag  Seal | |
| Country | |
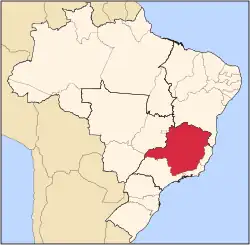
| Region | Southeast |
| State | Minas Gerais |
| Mesoregion | Oeste de Minas |
| Government | |
| • Mayor | Julert Ferri (PMDB) |
| Population (2020 [1]) | |
• Total | 42,413 |
| Time zone | UTC−3 (BRT) |
Machado is a municipality in the state of Minas Gerais in the Southeast region of Brazil.[2][3][4][5]
Geography
Climate
| Climate data for Machado (1991–2020) | |||||||||||||
|---|---|---|---|---|---|---|---|---|---|---|---|---|---|
| Month | Jan | Feb | Mar | Apr | May | Jun | Jul | Aug | Sep | Oct | Nov | Dec | Year |
| Mean daily maximum °C (°F) | 29.4 (84.9) |
29.7 (85.5) |
29.0 (84.2) |
28.1 (82.6) |
25.4 (77.7) |
24.6 (76.3) |
25.0 (77.0) |
27.0 (80.6) |
28.4 (83.1) |
29.1 (84.4) |
28.5 (83.3) |
29.2 (84.6) |
27.8 (82.0) |
| Daily mean °C (°F) | 22.9 (73.2) |
22.9 (73.2) |
22.3 (72.1) |
20.8 (69.4) |
17.7 (63.9) |
16.3 (61.3) |
16.3 (61.3) |
17.9 (64.2) |
20.3 (68.5) |
21.8 (71.2) |
21.9 (71.4) |
22.7 (72.9) |
20.3 (68.5) |
| Mean daily minimum °C (°F) | 18.6 (65.5) |
18.3 (64.9) |
17.7 (63.9) |
15.5 (59.9) |
12.0 (53.6) |
10.1 (50.2) |
9.6 (49.3) |
10.5 (50.9) |
13.6 (56.5) |
16.1 (61.0) |
17.2 (63.0) |
18.2 (64.8) |
14.8 (58.6) |
| Average precipitation mm (inches) | 282.8 (11.13) |
212.9 (8.38) |
176.0 (6.93) |
68.5 (2.70) |
62.0 (2.44) |
23.3 (0.92) |
19.4 (0.76) |
17.1 (0.67) |
70.9 (2.79) |
115.6 (4.55) |
174.8 (6.88) |
240.6 (9.47) |
1,463.9 (57.63) |
| Average precipitation days (≥ 1.0 mm) | 17.9 | 14.0 | 13.2 | 7.2 | 4.4 | 2.5 | 2.2 | 2.4 | 5.9 | 10.3 | 13.2 | 16.8 | 110.0 |
| Average relative humidity (%) | 81.2 | 79.4 | 80.6 | 79.5 | 79.7 | 79.6 | 75.1 | 67.5 | 67.0 | 71.3 | 76.8 | 80.2 | 76.5 |
| Average dew point °C (°F) | 19.9 (67.8) |
19.7 (67.5) |
19.5 (67.1) |
17.9 (64.2) |
15.1 (59.2) |
13.9 (57.0) |
13.1 (55.6) |
13.2 (55.8) |
14.8 (58.6) |
17.1 (62.8) |
18.3 (64.9) |
19.5 (67.1) |
16.8 (62.2) |
| Mean monthly sunshine hours | 141.0 | 151.6 | 156.2 | 175.5 | 173.6 | 160.8 | 183.7 | 208.5 | 170.8 | 169.9 | 146.8 | 143.9 | 1,982.3 |
| Source: NOAA[6] | |||||||||||||
See also
References
- ^ IBGE 2020
- ^ "Divisão Territorial do Brasil" (in Portuguese). Divisão Territorial do Brasil e Limites Territoriais, Instituto Brasileiro de Geografia e Estatística (IBGE). July 1, 2008. Retrieved December 17, 2009.
- ^ "Estimativas da população para 1º de julho de 2009" (PDF) (in Portuguese). Estimativas de População, Instituto Brasileiro de Geografia e Estatística (IBGE). August 14, 2009. Retrieved December 17, 2009.
- ^ "Ranking decrescente do IDH-M dos municípios do Brasil" (in Portuguese). Atlas do Desenvolvimento Humano, Programa das Nações Unidas para o Desenvolvimento (PNUD). 2000. Archived from the original on October 3, 2009. Retrieved December 17, 2009.
- ^ "Produto Interno Bruto dos Municípios 2002-2005" (PDF) (in Portuguese). Instituto Brasileiro de Geografia e Estatística (IBGE). December 19, 2007. Archived from the original (PDF) on October 2, 2008. Retrieved December 17, 2009.
- ^ "World Meteorological Organization Climate Normals for 1991-2020 — Machado". National Oceanic and Atmospheric Administration. Retrieved January 31, 2024.