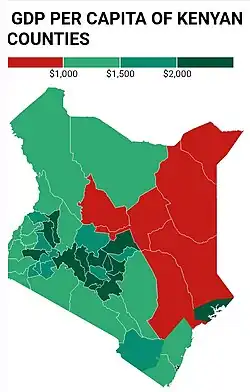
Counties of Kenya by GDP per Capita The List of counties of Kenya by Gross County Product (GCP) shows the economic output of counties in Kenya . It is calculated by the Kenya National Bureau of Statistics (KNBS), which aggregates the value of all goods and services produced within a county during a specific period. GCP is an essential indicator for assessing the economic performance and potential of different regions within the country. Nairobi County is the largest contributor to the national economy, accounting for approximately 27.5% of Kenya's Gross Domestic Product (GDP). It is followed by Nakuru ,Kiambu , Mombasa and Meru . Nairobi also ranks as the wealthiest county by GDP per capita, estimated at USD 6,300. It is closely followed by Mombasa County . Nakuru , Nyeri , Nyandarua , Lamu , and Embu , are also among the richest counties in the country.
Rank
County
GDP (Nominal) (US$ billion)
GDP (PPP) (US$ billion)
Per Capita (Nominal) (US$)
Per Capita (PPP) (US$)
1
Nairobi 29.544
88.038
6,324
18,844
2
Nakuru 6.091
18.151
2,649
7,894
3
Kiambu 5.898
17.575
2,266
6,754
4
Mombasa 5.159
15.374
4,018
11,974
5
Meru 3.752
11.180
2,336
6,962
6
Machakos 3.456
10.298
2,347
6,994
7
Uasin Gishu 2.708
8.068
2,197
6,546
8
Kisumu 2.661
7.929
2,167
6,459
9
Kilifi 2.297
6.846
1,484
4,423
10
Kakamega 2.262
6.741
1,150
3,426
11
Bungoma 2.083
6.207
1,185
3,530
12
Kisii 2.081
6.202
1,562
4,656
13
Murang’a 2.070
6.169
1,881
5,606
14
Nyeri 2.056
6.126
2,487
7,410
15
Narok 1.847
5.505
1,480
4,409
16
Trans-Nzoia 1.796
5.353
1,712
5,101
17
Kericho 1.787
5.326
1,897
5,652
18
Kajiado 1.718
5.120
1,387
4,134
19
Nandi 1.696
5.054
1,812
5,399
20
Bomet 1.642
4.892
1,771
5,277
21
Nyandarua 1.634
4.868
2,393
7,130
22
Embu 1.510
4.499
2,353
7,011
23
Homa Bay 1.430
4.261
1,183
3,526
24
Kitui 1.392
4.147
1,145
3,413
25
Kirinyaga 1.359
4.051
2,098
6,253
26
Kwale 1.281
3.818
1,389
4,138
27
Migori 1.252
3.732
1,039
3,097
28
Turkana 1.211
3.608
1,214
3,617
29
Makueni 1.172
3.491
1,137
3,387
30
Nyamira 1.170
3.486
1,790
5,335
31
Siaya 1.119
3.333
1,075
3,203
32
Elgeyo-Marakwet 1.086
3.235
2,223
6,625
33
Laikipia 0.993
2.960
1,805
5,378
34
Busia 0.960
2.860
1,010
3,010
35
Vihiga 0.846
2.520
1,363
4,061
36
Baringo 0.828
2.466
1,153
3,436
37
West Pokot 0.810
2.413
1,225
3,650
38
Taita-Taveta 0.689
2.054
1,918
5,714
39
Tharaka-Nithi 0.682
2.031
1,655
4,931
40
Marsabit 0.665
1.982
1,321
3,937
41
Garissa 0.588
1.751
649
1,935
42
Mandera 0.541
1.612
579
1,724
43
Wajir 0.536
1.596
631
1,882
44
Lamu 0.394
1.175
2,417
7,203
45
Tana River 0.336
1.000
976
2,910
46
Samburu 0.305
0.910
901
2,684
47
Isiolo 0.292
0.869
945
2,817
GDP Per Capita
Rank
County
Per Capita (Nominal) (US$)
Per Capita (PPP) (US$)
1
6,324
18,844
2
4,018
11,974
3
2,649
7,894
4
2,487
7,410
5
2,393
7,130
6
2,417
7,203
7
2,353
7,011
8
2,347
6,994
9
2,336
6,962
10
2,266
6,754
11
2,223
6,625
12
2,197
6,546
13
2,167
6,459
14
2,098
6,253
15
1,918
5,714
16
1,897
5,652
17
1,881
5,606
18
1,812
5,399
19
1,805
5,378
20
1,790
5,335
21
1,771
5,277
22
1,712
5,101
23
1,655
4,931
24
1,562
4,656
25
1,484
4,423
26
1,480
4,409
27
1,389
4,138
28
1,387
4,134
29
1,363
4,061
30
1,321
3,937
31
1,225
3,650
32
1,214
3,617
33
1,185
3,530
34
1,183
3,526
35
1,153
3,436
36
1,150
3,426
37
1,145
3,413
38
1,137
3,387
39
1,075
3,203
40
1,039
3,097
41
1,010
3,010
42
976
2,910
43
945
2,817
44
901
2,684
45
649
1,935
46
631
1,882
47
579
1,724
See also
References
External links