This article lists the provinces of South Africa by their gross regional domestic product (GDP).
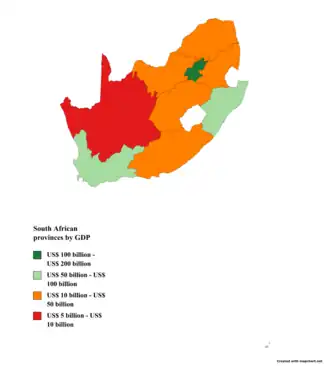 South African provinces by GDP
Total
| Rank
|
Province
|
GDP (2022; billion ZAR)[1]
|
GDP (2022; billion US$)[1]
|
GDP per capita (2022; US$)[1]
|
| 1
|
Gauteng
|
2,197.104
|
134.682
|
8,920
|
| 2
|
KwaZulu-Natal
|
1,055.386
|
64.695
|
5,210
|
| 3
|
Western Cape
|
918.203
|
56.286
|
7,572
|
| 4
|
Mpumalanga
|
531.771
|
32.598
|
6,339
|
| 5
|
Limpopo
|
511.391
|
31.348
|
5,800
|
| 6
|
Eastern Cape
|
500.950
|
30.708
|
4,250
|
| 7
|
North West
|
438.878
|
26.903
|
7,073
|
| 8
|
Free State
|
326.929
|
20.041
|
6,766
|
| 9
|
Northern Cape
|
147.939
|
9.069
|
6,690
|
| South Africa
|
6,628.550
|
406.330
|
6,532
|
Per capita
| Rank
|
Province
|
Population (2022)[2]
|
GDP (2013; ZAR millions)[3]
|
GDP per capita (2013; ZAR)
|
GDP per capita (2013; USD PPP)
|
| 1
|
Gauteng
|
15,099,422
|
1,194,140
|
94,179
|
18,259
|
| 2
|
Western Cape
|
7,433,019
|
485,545
|
80,839
|
15,673
|
| 3
|
North West
|
3,804,548
|
239,020
|
66,171
|
12,829
|
| 4
|
Mpumalanga
|
5,143,324
|
269,863
|
64,910
|
12,585
|
| 5
|
Free State
|
2,964,412
|
179,776
|
64,909
|
12,584
|
| 6
|
Northern Cape
|
1,355,946
|
71,142
|
61,388
|
11,902
|
| 7
|
KwaZulu-Natal
|
12,423,907
|
565,226
|
53,674
|
10,406
|
| 8
|
Limpopo
|
6,572,720
|
256,896
|
46,336
|
8,983
|
| 9
|
Eastern Cape
|
7,230,204
|
272,714
|
40,712
|
7,893
|
 South Africa South Africa
|
62,027,503
|
3,534,330
|
66,488
|
12,890
|
See also
References