2024 Guam general election|
|
|
|
Legislative election |
|
|
| Turnout | 48.77% ( 7.58pp) 7.58pp) |
|---|
|
|
 |
|
|
|
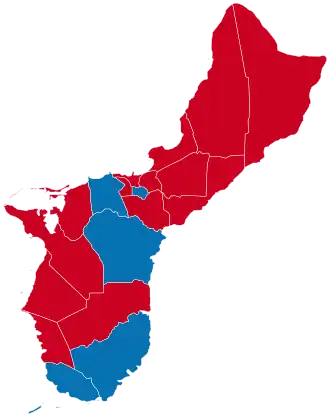
General elections were held in Guam on November 5, 2024.[1] Voters in Guam chose their non-voting delegate to the United States House of Representatives, attorney general, supreme court judges and all fifteen members of the territorial legislature. The elections were held on the same day as the 2024 United States elections.
This was the first time since 2006 that Republicans gained a majority in the legislature.
Results
Legislature
 |
|---|
| Party | Votes | % | Seats | +/– |
|---|
| Republican Party | 163,485 | 53.67 | 9 | +3 |
| Democratic Party | 140,197 | 46.02 | 6 | –3 |
| Write-in | 947 | 0.31 | – | – |
| Total | 304,629 | 100.00 | 15 | 0 |
|
| Valid votes | 30,277 | 99.98 | |
|---|
| Invalid/blank votes | 6 | 0.02 | |
|---|
| Total votes | 30,283 | 100.00 | |
|---|
| Registered voters/turnout | 62,098 | 48.77 | |
|---|
| Source: Guam Election Commission[2] |
Results by candidate
| Candidate | Party | Votes | % |
|---|
| Therese M. Terlaje | Democratic Party | 20,189 | 6.63 |
| Darrel Christopher Barnett | Democratic Party | 18,139 | 5.95 |
| Vicente Anthony Borja Ada | Republican Party | 16,711 | 5.49 |
| Joe Shimizu San Agustin | Democratic Party | 15,501 | 5.09 |
| Tina Rose Muna Barnes | Democratic Party | 14,662 | 4.81 |
| Sabrina Salas Matanane | Republican Party | 14,659 | 4.81 |
| Jesse Anderson Lujan | Republican Party | 14,185 | 4.66 |
| Frank Flores Blas Jr. | Republican Party | 14,020 | 4.60 |
| Shelly Calvo | Republican Party | 13,149 | 4.32 |
| William Mark Parkinson | Democratic Party | 12,503 | 4.10 |
| Christopher M. Duenas | Republican Party | 12,254 | 4.02 |
| Vincent A. V. Borja | Republican Party | 12,143 | 3.99 |
| Sabina E. Perez | Democratic Party | 12,077 | 3.96 |
| Telo Teresa Taitague | Republican Party | 11,627 | 3.82 |
| Eulogio Shawn Gumataotao | Republican Party | 11,526 | 3.78 |
| Roy Anthony Quinata | Democratic Party | 11,246 | 3.69 |
| Dwayne Thomas San Nicolas | Democratic Party | 11,240 | 3.69 |
| Joanne M. Brown | Republican Party | 11,103 | 3.64 |
| Angela Therese Ann Santos | Democratic Party | 10,431 | 3.42 |
| Thomas Joseph Fisher | Republican Party | 10,247 | 3.36 |
| Victor A. Gaza | Republican Party | 8,916 | 2.93 |
| David Walter Crisostomo | Democratic Party | 7,606 | 2.50 |
| William Payne | Republican Party | 7,188 | 2.36 |
| David Ralph Duenas | Democratic Party | 6,603 | 2.17 |
| Bistra Ivanova Mendiola | Republican Party | 5,757 | 1.89 |
| Write-in | 947 | 0.31 |
| Total | 304,629 | 100.00 |
|
| Valid votes | 30,277 | 99.98 |
|---|
| Invalid/blank votes | 6 | 0.02 |
|---|
| Total votes | 30,283 | 100.00 |
|---|
| Registered voters/turnout | 62,098 | 48.77 |
|---|
| Source: [2] |
US President
US House
Local elections
References
|
|---|
U.S.
President | |
|---|
U.S.
Senate | |
|---|
U.S.
House
(election
ratings) | |
|---|
| Governors | |
|---|
Lieutenant
governors | |
|---|
Attorneys
general | |
|---|
Secretaries
of state | |
|---|
State
treasurers | |
|---|
| Judicial | |
|---|
Other
statewide
elections |
- Alabama
- Arizona
- Delaware
- Georgia
- Montana
- New Hampshire
- North Carolina
- North Dakota
- Oklahoma
- Pennsylvania
- Texas
- Utah
- Vermont
- Washington
- West Virginia
|
|---|
State
legislative |
- Alaska
- Arizona
- Arkansas
- California
- Colorado
- Connecticut
- Delaware
- Florida
- Georgia
- Hawaii
- Idaho
- Illinois
- Indiana
- Iowa
- Kansas
- Kentucky
- Maine
- Massachusetts
- Michigan
- Minnesota
- Missouri
- Montana
- Nebraska
- Nevada
- New Hampshire
- New Mexico
- New York
- North Carolina
- North Dakota
- Ohio
- Oklahoma
- Oregon
- Pennsylvania
- Puerto Rico
- Rhode Island
- South Carolina
- South Dakota
- Tennessee
- Texas
- Utah
- Vermont
- Washington
- West Virginia
- Wisconsin
- Wyoming
- Special elections
|
|---|
| Mayors |
- Alexandria, VA
- Anchorage, AK
- Austin, TX
- Bakersfield, CA
- Baltimore, MD
- Baton Rouge, LA
- Bridgeport, CT
- Burlington, VT
- Cheyenne, WY
- El Paso, TX
- Fayetteville, AR
- Fort Lauderdale, FL
- Fresno, CA
- Grand Rapids, MI
- Honolulu, HI
- Huntington, WV
- Huntsville, AL
- Irvine, CA
- Las Vegas, NV
- Lubbock, TX
- Mesa, AZ
- Miami-Dade County, FL
- Milwaukee, WI
- North Miami, FL
- Phoenix, AZ
- Portland, OR
- Pueblo, CO
- Raleigh, NC
- Richmond, VA
- Riverside, CA
- Sacramento, CA
- Salt Lake County, UT
- San Diego, CA
- San Francisco, CA
- San Jose, CA
- Stockton, CA
- Tulsa, OK
- Virginia Beach, VA
- Wilmington, DE
|
|---|
| Local |
- Alameda County, CA (recall)
- Chicago, IL
- Louisville, KY
- Los Angeles, CA
- Los Angeles County, CA
- Maricopa County, AZ
- New Castle County, DE
- Multnomah County, OR
- Orange County, CA
- Portland, OR
- San Diego, CA
- San Francisco, CA
- San Mateo County, CA
- Tulsa, OK
- Washington, D.C.
|
|---|
States and
territories | |
|---|
Ballot
measures |
- Alabama
- Alaska
- Arizona
- California
- Colorado
- District of Columbia
- Florida
- Hawaii
- Idaho
- Kentucky
- Maine
- Maryland
- Missouri
- Montana
- Nebraska
- Nevada
- New York
- Ohio
- Oregon
- Puerto Rico
- South Dakota
- Wyoming
|
|---|