Overall Result
Legislative Assembly elections

|
| NATIONAL PARTIES
|
CONTESTED
|
WON
|
FD
|
VOTES
|
%
|
SEATS
|
| 1. INC
|
59
|
37
|
0
|
154463
|
44.25%
|
44.85%
|
| 2. JD
|
52
|
11
|
1
|
116383
|
33.34%
|
36.21%
|
| 3. JNP(JP)
|
7
|
1
|
4
|
7952
|
2.28%
|
14.77%
|
| INDEPENDENTS
|
|
|
|
|
|
|
| 4. IND
|
52
|
11
|
21
|
70300
|
20.14%
|
32.72%
|
| Grand Total :
|
170
|
60
|
26
|
349098
|
|
|
 |
|---|
| Party | Votes | % | Seats | +/– |
|---|
| Indian National Congress | 105,207 | 25.04 | 11 |  4 4 |
| Dravida Munnetra Kazhagam | 101,127 | 24.07 | 9 |  4 4 |
| All India Anna Dravida Munnetra Kazhagam | 76,337 | 18.17 | 3 | 3 |
| Janata Dal | 38,145 | 9.08 | 4 | New |
| Communist Party of India | 21,323 | 5.07 | 2 | 2 |
| Others | 44,475 | 10.58 | 0 | 0 |
| Independents | 33,557 | 7.99 | 1 | 1 |
| Total | 420,171 | 100.00 | 30 | 0 |
|
| Valid votes | 420,171 | 99.19 | |
|---|
| Invalid/blank votes | 3,416 | 0.81 | |
|---|
| Total votes | 423,587 | 100.00 | |
|---|
| Registered voters/turnout | 585,194 | 72.38 | |
|---|
| Source: ECI[1] |
| Party |
Seats contested |
Seats |
Seat change |
Popular vote |
Percentage
|
|
|
Janata Dal
|
276
|
122
|
New Party
|
8,212,666
|
25.61%
|
|
|
Indian National Congress
|
323
|
71
|
125
|
7,946,635
|
24.78%
|
|
|
Bharatiya Janata Party
|
237
|
39
|
23
|
3,721,392
|
11.61%
|
|
|
Communist Party of India
|
109
|
23
|
11
|
2,112,887
|
6.59%
|
|
|
Jharkhand Mukti Morcha
|
82
|
19
|
10
|
1,008,174
|
3.14%
|
|
|
Indian People's Front
|
82
|
7
|
New Party
|
889,068
|
2.77%
|
|
|
Communist Party of India (Marxist)
|
31
|
6
|
5
|
427,214
|
1.33%
|
|
|
Janata Party (JP)
|
158
|
3
|
New Party
|
494,717
|
1.54%
|
|
|
Marxist Co-ordination
|
11
|
2
|
New Party
|
70,365
|
0.22%
|
|
|
Jharkhand Dal
|
28
|
1
|
New Party
|
134,827
|
0.42%
|
|
|
Socialist Party (Lohia)
|
47
|
1
|
New Party
|
109,871
|
0.34%
|
|
|
Independents
|
4320
|
30
|
1
|
5,907,134
|
18.42%
|
|
|
Total
|
6629
|
324
|
|
32,063,793
|
|
Source:[2]
| Parties and coalitions
|
Popular vote
|
Seats
|
| Votes
|
%
|
Won
|
+/−
|
| Janata Dal
|
3,725,148
|
29.36
|
70 |
+70
|
| Bharatiya Janata Party (BJP)
|
3,386,256
|
26.69
|
67 |
+56
|
| Indian National Congress (INC)
|
3,899,159 |
30.74
|
33
|
−116
|
| Yuva Vikas Party (YVP)
|
1,07,220
|
2.47
|
1
|
+1
|
| JNP
|
69,829
|
0.55
|
0
|
0
|
| CPM
|
37,436
|
0.30
|
0
|
0
|
| CPI
|
11,377
|
0.09
|
0
|
0
|
| Bahujan Samaj Party (BSP)
|
4,565 |
0.04
|
0
|
0
|
| Independents (IND)
|
1,323,790 |
10.44
|
11 |
|
|
|
| Total
|
12,685,977 |
100
|
182 |
±0
|
|
|
| Valid votes
|
12,685,977
|
98.03
|
|
| Invalid votes
|
2,69,244
|
1.97
|
| Votes cast / turnout
|
12,955,221
|
52.20
|
| Registered voters
|
24,820,379
|
|
 |
|---|
| Party | Votes | % | Seats | +/– |
|---|
| Bharatiya Janata Party | 858,518 | 41.78 | 46 | +39 |
| Indian National Congress | 750,885 | 36.54 | 9 | –49 |
| Janata Dal | 222,542 | 10.83 | 11 | New |
| Communist Party of India | 42,393 | 2.06 | 1 | +1 |
| Others | 55,139 | 2.68 | 0 | 0 |
| Independents | 125,421 | 6.10 | 1 | –1 |
| Total | 2,054,898 | 100.00 | 68 | 0 |
|
| Valid votes | 2,054,898 | 99.20 | |
|---|
| Invalid/blank votes | 16,625 | 0.80 | |
|---|
| Total votes | 2,071,523 | 100.00 | |
|---|
| Registered voters/turnout | 2,993,699 | 69.20 | |
|---|
| Source: ECI[3] |
Source:[4]
| Political Party
|
No. of candidates
|
No. of elected
|
Votes polled
|
Votes (%)
|
Seat change
|
| Indian National Congress
|
276
|
141
|
11,334,773
|
38.17%
|
20
|
| Shiv Sena
|
183
|
52
|
4,733,834
|
15.94%
|
52
|
| Bharatiya Janata Party
|
104
|
42
|
3,180,482
|
10.71%
|
26
|
| Janata Dal
|
214
|
24
|
3,776,737
|
12.72%
|
24
|
| Peasants and Workers Party of India
|
40
|
8
|
719,807
|
2.42%
|
5
|
| Communist Party of India (Marxist)
|
13
|
3
|
258,433
|
0.87%
|
1
|
| Communist Party of India
|
16
|
2
|
219,080
|
0.74%
|

|
| Indian Congress (Socialist) – Sarat Chandra Sinha
|
71
|
1
|
290,503
|
0.98%
|
1
|
| Independents
|
2286
|
13
|
4,036,403
|
13.59%
|
7
|
| Party | Votes | % | Seats | +/– |
|---|
| Indian National Congress | 333,765 | 33.71 | 24 | –6 |
| Janata Dal | 196,207 | 19.82 | 11 | New |
| Manipur Peoples Party | 192,075 | 19.40 | 9 | +6 |
| Indian Congress (Socialist) – Sarat Chandra Sinha | 122,829 | 12.41 | 4 | New |
| Communist Party of India | 41,012 | 4.14 | 3 | +2 |
| Kuki National Assembly | 25,867 | 2.61 | 2 | +1 |
| Bharatiya Janata Party | 18,549 | 1.87 | 0 | 0 |
| Manipur Hill People's Council | 8,820 | 0.89 | 0 | New |
| National People's Party (India) | 7,762 | 0.78 | 1 | New |
| Independents | 43,101 | 4.35 | 0 | –21 |
| Total | 989,987 | 100.00 | 54 | –6 |
|
| Valid votes | 989,987 | 98.90 | |
|---|
| Invalid/blank votes | 10,997 | 1.10 | |
|---|
| Total votes | 1,000,984 | 100.00 | |
|---|
| Registered voters/turnout | 1,112,853 | 89.95 | |
|---|
| Source: ECI[5] |
 |
|---|
| Party | Votes | % | Seats | +/– |
|---|
| Janata Dal | 5,884,443 | 53.69 | 123 | +102 |
| Indian National Congress | 3,264,000 | 29.78 | 10 | –107 |
| Bharatiya Janata Party | 390,060 | 3.56 | 2 | +1 |
| Communist Party of India | 326,364 | 2.98 | 5 | +4 |
| Communist Party of India (Marxist) | 91,767 | 0.84 | 1 | 0 |
| Others | 196,953 | 1.80 | 0 | 0 |
| Independents | 807,000 | 7.36 | 6 | –1 |
| Total | 10,960,587 | 100.00 | 147 | 0 |
|
| Valid votes | 10,960,587 | 98.02 | |
|---|
| Invalid/blank votes | 221,565 | 1.98 | |
|---|
| Total votes | 11,182,152 | 100.00 | |
|---|
| Registered voters/turnout | 19,745,549 | 56.63 | |
|---|
| Source: ECI[6] |
 |
|---|
| Party | Votes | % | Seats | +/– |
|---|
| Indian National Congress | 4,988,699 | 33.64 | 50 | –63 |
| Bharatiya Janata Party | 3,744,945 | 25.25 | 85 | +46 |
| Janata Dal | 3,200,662 | 21.58 | 55 | +45 |
| Communist Party of India (Marxist) | 152,555 | 1.03 | 1 | +1 |
| Others | 539,733 | 3.64 | 0 | 0 |
| Independents | 2,202,088 | 14.85 | 9 | –1 |
| Total | 14,828,682 | 100.00 | 200 | 0 |
|
| Valid votes | 14,828,682 | 98.37 | |
|---|
| Invalid/blank votes | 245,106 | 1.63 | |
|---|
| Total votes | 15,073,788 | 100.00 | |
|---|
| Registered voters/turnout | 26,405,624 | 57.09 | |
|---|
| Source: ECI[7] |
References
External links
|
|---|
| General elections | |
|---|
| State elections | |
|---|
- See also: Elections in the Andaman and Nicobar Islands
- Andhra Pradesh
- Arunachal Pradesh
- Assam
- Bihar
- Chhattisgarh
- Chandigarh
- Delhi
- Goa
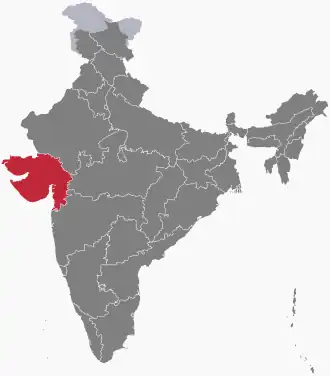
- Gujarat
- Haryana
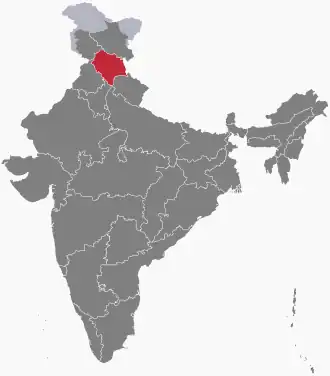
- Himachal Pradesh
- Jammu and Kashmir
- Jharkhand
- Karnataka
- Kerala
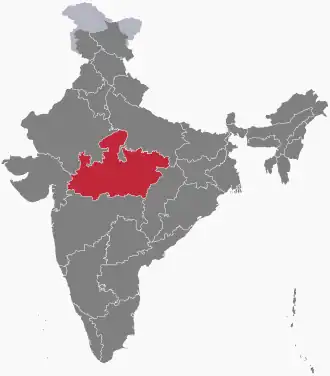
- Madhya Pradesh
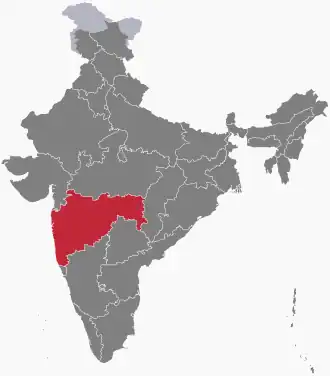
- Maharashtra
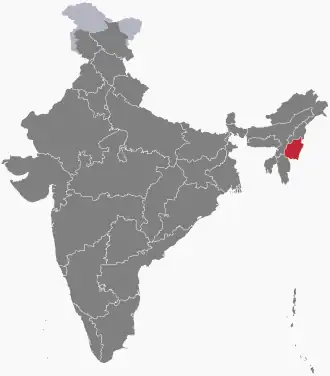
- Manipur
- Meghalaya
- Mizoram
- Nagaland
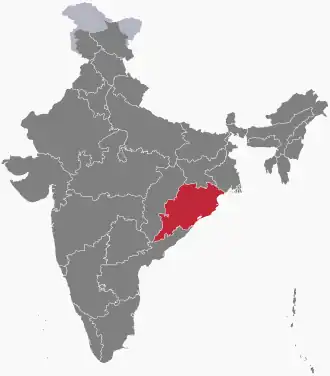
- Odisha
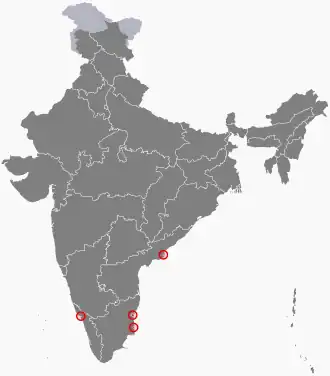
- Puducherry
- Punjab
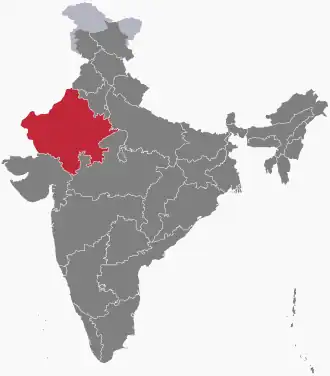
- Rajasthan
- Sikkim
- Tamil Nadu
- Telangana
- Tripura
- Uttar Pradesh
- Uttarakhand
- West Bengal
Presidential elections
- Vice presidential elections
- Rajya Sabha elections
|