General Elections
Party Votes % Seats Indian National Congress 115,478,267 49.10 404 Bharatiya Janata Party 18,202,853 7.74 2 Janata Party 16,210,514 6.89 10 Lokdal 14,040,064 5.97 3 Communist Party of India (Marxist) 13,809,950 5.87 22 Telugu Desam Party 10,132,859 4.31 30 Communist Party of India 6,363,430 2.71 6 Dravida Munnetra Kazhagam 5,695,179 2.42 2 All India Anna Dravida Munnetra Kazhagam 3,968,967 1.69 12 Indian Congress (Socialist) 3,577,377 1.52 4 Indian National Congress (Jagjivan) 1,511,515 0.64 1 Revolutionary Socialist Party 1,173,869 0.50 3 All India Forward Bloc 1,055,556 0.45 2 Jammu & Kashmir National Conference 1,010,243 0.43 3 Indian Union Muslim League 658,821 0.28 2 Kerala Congress (Joseph) 598,113 0.25 2 Doordarshi Party 508,426 0.22 0 Peasants and Workers Party of India 463,963 0.20 1 Jharkhand Mukti Morcha 332,403 0.14 0 Kerala Congress 258,591 0.11 0 All India Muslim League 224,155 0.10 0 Gandhi Kamraj National Congress 217,104 0.09 0 Socialist Unity Centre of India 196,767 0.08 0 Republican Party of India (Khobragade) 165,320 0.07 0 Manipur Peoples Party 149,019 0.06 0 Tamil Nadu Congress (K) 144,076 0.06 0 Naga National Democratic Party 113,919 0.05 0 Jammu & Kashmir Panthers Party 95,149 0.04 0 Maharashtrawadi Gomantak Party 83,122 0.04 0 People's Party of Arunachal 78,455 0.03 0 Republican Party of India 22,877 0.01 0 Jharkhand Party 18,837 0.01 0 Jammu & Kashmir Peoples Conference 646 0.00 0 Independents 18,623,803 7.92 5 Appointed Anglo-Indians 2 Total 235,184,209 100.00 516 Valid votes 235,184,209 97.49 Invalid/blank votes 6,062,678 2.51 Total votes 241,246,887 100.00 Registered voters/turnout 379,540,608 63.56 Source: ECI[ 1]
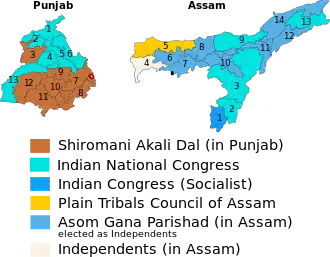
Delayed elections in Assam and Punjab
Results from 1985 Party Votes % Seats Indian National Congress 4,628,777 32.14 10 Shiromani Akali Dal 2,577,279 17.90 7 Communist Party of India (Marxist) 462,576 3.21 0 Indian Congress (Socialist) 457,705 3.18 1 Communist Party of India 369,687 2.57 0 Plain Tribals Council of Assam 310,150 2.15 1 Bharatiya Janata Party 263,284 1.83 0 Janata Party 420,082 2.92 0 Lokdal 46,627 0.32 0 Independents 4,864,958 33.78 8 Total 14,401,125 100.00 27 Valid votes 14,401,125 95.70 Invalid/blank votes 646,951 4.30 Total votes 15,048,076 100.00 Registered voters/turnout 20,834,725 72.23 Source: ECI[ 2]
Overall Result
Legislative Assembly elections
Source:[ 3]
Party
Contested
Won
Votes
%
INC
30
21
96791
43.07%
PPA
13
4
34910
15.54%
BJP
6
1
17,283
7.69%
JNP
3
0
845
0.38%
Independents
63
4
74888
33.33%
Total
115
30
224717
Party Votes % Seats +/– Indian National Congress 160,944 39.48 18 +18 Maharashtrawadi Gomantak Party 86,100 21.12 8 +1 Bharatiya Janata Party 4,915 1.21 0 New Janata Party 3,013 0.74 0 0 Communist Party of India 1,554 0.38 0 New Communist Party of India (Marxist) 756 0.19 0 0 Independents 150,424 36.90 4 +1 Total 407,706 100.00 30 0 Valid votes 407,706 96.72 Invalid/blank votes 13,844 3.28 Total votes 421,550 100.00 Registered voters/turnout 586,657 71.86 Source: ECI[ 4]
Party Votes % Seats +/– Indian National Congress 257,809 29.82 30 +30 Manipur Peoples Party 93,421 10.81 3 –1 Janata Party 52,530 6.08 4 –6 Communist Party of India 35,852 4.15 1 –4 Indian Congress (Socialist) 28,156 3.26 0 New Kuki National Assembly 13,367 1.55 1 –1 Bharatiya Janata Party 6,163 0.71 0 New Lok Dal 3,653 0.42 0 New Communist Party of India (Marxist) 790 0.09 0 –1 Independents 372,766 43.12 21 +2 Total 864,507 100.00 60 0 Valid votes 864,507 97.70 Invalid/blank votes 20,362 2.30 Total votes 884,869 100.00 Registered voters/turnout 1,013,680 87.29 Source: ECI[ 5]
Election map of results based on parties. Colours are based on the results table on the left
Alliance/Party
Seats won
Change
Popular Vote
Vote %
Adj. %‡
AIADMK+ alliance
195
+29
11,681,221
53.9%
AIADMK
132
+3
8,030,809
37.0%
54.3%
INC
61
+30
3,529,708
16.3%
54.5%
Indian National Congress breakaway parties
2
-4
120,704
0.6%
40.4%
DMK+ alliance
34
-25
8,021,293
37.0%
DMK
24
-13
6,362,770
29.3%
40.8%
CPI(M)
5
-6
597,622
2.8%
39.6%
JP
3
+1
493,374
2.3%
36.4%
CPI
2
-7
567,527
2.6%
35.5%
Others
5
-4
1,983,959
9.1%
Independent
4
-4
1,619,921
7.5%
7.9%
AKD
1
–
47,212
0.7%
57.2%
TNC(K)
0
–
152,315
0.7%
34.9%
INC(J)
0
–
110,121
0.5%
3.2%
BJP
0
–
54,390
0.3%
3.7%
Total
234
–
21,686,473
100%
–
‡ : Vote % reflects the percentage of votes the party received compared to the entire electorate that voted in this election. Adjusted (Adj.) Vote %, reflects the % of votes the party received per constituency that they contested.
ECI [ 7]
References
External links
General elections State elections
See also: Elections in the Andaman and Nicobar Islands
Andhra Pradesh
Arunachal Pradesh
Assam
Bihar
Chhattisgarh
Chandigarh
Delhi
Goa
Gujarat
Haryana
Himachal Pradesh
Jammu and Kashmir
Jharkhand
Karnataka
Kerala
Madhya Pradesh
Maharashtra
Manipur
Meghalaya
Mizoram
Nagaland
Odisha
Puducherry
Punjab
Rajasthan
Sikkim
Tamil Nadu
Telangana
Tripura
Uttar Pradesh
Uttarakhand
West Bengal
Vice presidential elections
Rajya Sabha elections