Xingren
Xingren
兴仁市 | |
|---|---|
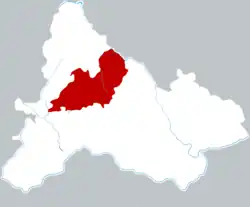 | |
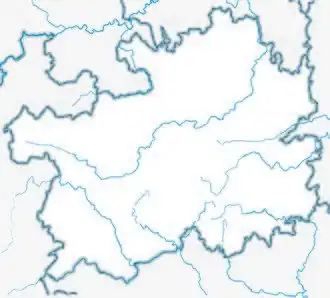 Xingren Location of the city center in Guizhou 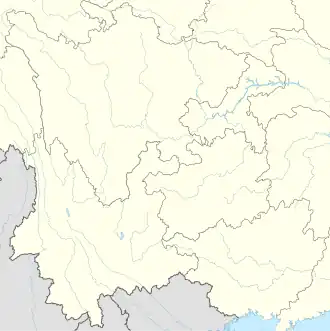 Xingren Xingren (Southwest China) | |
| Coordinates (Xingren municipal government): 25°26′06″N 105°11′10″E / 25.4350°N 105.1862°E | |
| Country | China |
| Province | Guizhou |
| Autonomous prefecture | Qianxinan |
| Municipal seat | Chengbei Subdistrict |
| Area | |
• Total | 1,785 km2 (689 sq mi) |
| Elevation | 1,354 m (4,442 ft) |
| Population (2020 census)[1] | |
• Total | 425,770 |
| • Density | 240/km2 (620/sq mi) |
| Time zone | UTC+8 (China Standard) |
| Postal code | 562300 |
| Website | www |
Xingren (simplified Chinese: 兴仁市; traditional Chinese: 興仁市; pinyin: Xīngrén Shì) is a county-level city of southwestern Guizhou province, China. It is under the administration of the Qianxinan Buyei and Miao Autonomous Prefecture.
Administrative divisions
Xingren has 6 subdistricts, 11 towns and 1 ethnic township:[2]
- subdistricts
- Donghu Subdistrict (东湖街道)
- Chengnan Subdistrict (城南街道)
- Zhenwushan Subdistrict (真武山街道)
- Chengbei Subdistrict (城北街道)
- Luguan Subdistrict (陆官街道)
- Yipintianyuan Subdistrict (薏品田园街道)
- towns
- Tunjiao Town (屯脚镇)
- Baling Town (巴铃镇)
- Baide Town (百德镇)
- Yuzhang Town (雨樟镇)
- Panjiazhuang Town (潘家庄镇)
- Huilong Town (回龙镇)
- Xiashan Town (下山镇)
- Xinlongchang Town (新龙场镇)
- Dashan Town (大山镇)
- Mamaya Town (马马崖镇)
- Boyang Town (波阳镇
- ethnic townships
- Luchuying Hui Ethnic Township (鲁础营回族乡)
Geography and climate
Due to its low latitude and elevation above 1,300 m (4,265.09 ft), Xingren has a monsoon-influenced humid subtropical climate (Köppen Cwa), bordering on a subtropical highland climate (Köppen Cwb) with very warm, rainy summers and mild, damp winters. The monthly 24-hour average temperature ranges from 6.6 °C (43.9 °F) in January to 22.3 °C (72.1 °F) in July, while the annual mean is 15.7 °C (60.3 °F). Rainfall is very common year-round, occurring on 175 days of the year, but over 75% of the annual total (1,294 mm or 51 in) occurs from May to September. With monthly percent possible sunshine ranging from 24% in January to 40% in April, the county receives 1,441 hours of bright sunshine annually, with spring and summer sunnier than autumn and winter.
| Climate data for Xingren, elevation 1,379 m (4,524 ft), (1991–2020 normals, extremes 1971–2010) | |||||||||||||
|---|---|---|---|---|---|---|---|---|---|---|---|---|---|
| Month | Jan | Feb | Mar | Apr | May | Jun | Jul | Aug | Sep | Oct | Nov | Dec | Year |
| Record high °C (°F) | 27.6 (81.7) |
29.6 (85.3) |
32.7 (90.9) |
33.8 (92.8) |
35.5 (95.9) |
33.4 (92.1) |
32.7 (90.9) |
32.1 (89.8) |
32.0 (89.6) |
30.2 (86.4) |
28.1 (82.6) |
25.4 (77.7) |
35.5 (95.9) |
| Mean daily maximum °C (°F) | 11.0 (51.8) |
14.4 (57.9) |
18.7 (65.7) |
23.2 (73.8) |
25.2 (77.4) |
26.0 (78.8) |
26.8 (80.2) |
26.9 (80.4) |
24.7 (76.5) |
20.4 (68.7) |
17.5 (63.5) |
12.4 (54.3) |
20.6 (69.1) |
| Daily mean °C (°F) | 6.6 (43.9) |
9.3 (48.7) |
13.0 (55.4) |
17.5 (63.5) |
20.1 (68.2) |
21.6 (70.9) |
22.3 (72.1) |
21.9 (71.4) |
19.8 (67.6) |
16.2 (61.2) |
12.6 (54.7) |
8.1 (46.6) |
15.7 (60.4) |
| Mean daily minimum °C (°F) | 3.9 (39.0) |
5.9 (42.6) |
9.3 (48.7) |
13.5 (56.3) |
16.4 (61.5) |
18.6 (65.5) |
19.4 (66.9) |
18.7 (65.7) |
16.7 (62.1) |
13.7 (56.7) |
9.6 (49.3) |
5.3 (41.5) |
12.6 (54.7) |
| Record low °C (°F) | −4.4 (24.1) |
−6.2 (20.8) |
−2.5 (27.5) |
2.9 (37.2) |
7.4 (45.3) |
11.6 (52.9) |
12.0 (53.6) |
12.8 (55.0) |
7.2 (45.0) |
3.3 (37.9) |
−1.3 (29.7) |
−4.9 (23.2) |
−6.2 (20.8) |
| Average precipitation mm (inches) | 29.8 (1.17) |
21.0 (0.83) |
41.3 (1.63) |
55.0 (2.17) |
145.4 (5.72) |
282.0 (11.10) |
249.7 (9.83) |
179.3 (7.06) |
134.3 (5.29) |
96.9 (3.81) |
37.2 (1.46) |
22.4 (0.88) |
1,294.3 (50.95) |
| Average precipitation days (≥ 0.1 mm) | 15.3 | 12.3 | 13.2 | 13.3 | 15.9 | 18.6 | 18.4 | 16.3 | 13.2 | 15.6 | 10.4 | 12.7 | 175.2 |
| Average snowy days | 2.8 | 1.4 | 0.2 | 0 | 0 | 0 | 0 | 0 | 0 | 0 | 0.1 | 0.8 | 5.3 |
| Average relative humidity (%) | 83 | 77 | 74 | 71 | 74 | 81 | 82 | 82 | 81 | 83 | 80 | 82 | 79 |
| Mean monthly sunshine hours | 79.5 | 101.7 | 124.8 | 153.2 | 151.9 | 114.2 | 143.0 | 155.8 | 124.2 | 92.2 | 117.0 | 83.4 | 1,440.9 |
| Percentage possible sunshine | 24 | 32 | 33 | 40 | 37 | 28 | 34 | 39 | 34 | 26 | 36 | 26 | 32 |
| Source 1: China Meteorological Administration[3][4] | |||||||||||||
| Source 2: Weather China[5] | |||||||||||||
References
- ^ "黔西南州第七次全国人口普查公报(第二号)——地区人口情况" (in Chinese). Government of Qianxinan Prefecture. 2021-06-03. Archived from the original on 2024-12-17. Retrieved 2023-09-10.
- ^ 2023年统计用区划代码和城乡划分代码:兴仁市 (in Simplified Chinese). National Bureau of Statistics of China.
- ^ 中国气象数据网 – WeatherBk Data (in Simplified Chinese). China Meteorological Administration. Retrieved 28 April 2023.
- ^ 中国气象数据网 (in Simplified Chinese). China Meteorological Administration. Retrieved 28 April 2023.
- ^ 兴仁 - 气象数据 -中国天气网 (in Chinese). Weather China. Retrieved 26 November 2022.