Wales constituency election results in the 1929 United Kingdom general election
| 33rd Parliament | (1923) |
| 34th Parliament | (1924) |
| 35th Parliament | (1929) |
| 36th Parliament | (1931) |
| 37th Parliament | (1935) |
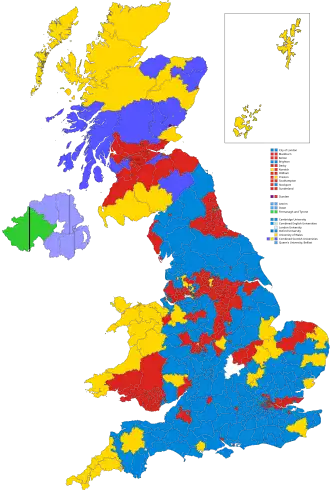
This is a complete alphabetical list of election results from constituencies in Wales to the 35th Parliament of the United Kingdom at the 1929 general election, held on 30 May 1929.
Wales
- Change in % vote and swing is calculated between the winner and second place and their respective performances at the 1924 election. A plus denotes a swing to the winner and a minus against the winner.
| Party | Candidate | Votes | % | ±% | |
|---|---|---|---|---|---|
| Labour | William Cove | 22,194 | 55.9 | +2.8 | |
| Liberal | William Henry Williams | 13,155 | 33.2 | −13.7 | |
| Unionist | Francis Bertram Reece | 4,330 | 10.9 | n/a | |
| Majority | 9,039 | 22.7 | +16.5 | ||
| Turnout | 87.0 | −2.6 | |||
| Labour hold | Swing | +8.2 | |||
| Party | Candidate | Votes | % | ±% | |
|---|---|---|---|---|---|
| Labour | George Hall | 29,550 | 64.6 | ||
| Liberal | Evan Joshua Roderick | 10,594 | 23.2 | ||
| Unionist | Hugh Molson | 5,573 | 12.2 | ||
| Majority | 18,956 | 41.4 | |||
| Turnout | 84.5 | ||||
| Labour hold | Swing | ||||
| Party | Candidate | Votes | % | ±% | |
|---|---|---|---|---|---|
| Labour | George Daggar | 20,175 | 64.5 | n/a | |
| Liberal | Walter Reynolds Meredith | 8,425 | 26.9 | n/a | |
| Unionist | Peter John Feilding Chapman-Walker | 2,697 | 8.6 | n/a | |
| Majority | 11,750 | 37.6 | n/a | ||
| Turnout | 82.4 | n/a | |||
| Labour hold | Swing | n/a | |||
| Party | Candidate | Votes | % | ±% | |
|---|---|---|---|---|---|
| Liberal | Megan Lloyd George | 13,181 | 49.4 | −14.5 | |
| Labour | William Edwards | 7,563 | 28.4 | −7.7 | |
| Unionist | Albert Hughes | 5,917 | 22.2 | n/a | |
| Majority | 5,618 | 21.0 | −6.8 | ||
| Turnout | 79.8 | ||||
| Liberal hold | Swing | -3.4 | |||
| Party | Candidate | Votes | % | ±% | |
|---|---|---|---|---|---|
| Labour | Charles Edwards | 26,021 | 78.95 | N/A | |
| Unionist | Hubert Geoffrey Griffith | 6,936 | 21.05 | N/A | |
| Majority | 19,085 | 57.9 | N/A | ||
| Turnout | 32,957 | 74.86 | N/A | ||
| Labour hold | Swing | N/A | |||
| Party | Candidate | Votes | % | ±% | |
|---|---|---|---|---|---|
| Labour | Peter Freeman | 14,511 | 33.7 | +3.2 | |
| Unionist | Walter Hall | 14,324 | 33.3 | −5.1 | |
| Liberal | Elias Wynne Cemlyn-Jones | 14,182 | 33.0 | +1.9 | |
| Majority | 187 | 0.4 | n/a | ||
| Turnout | 87.7 | +4.1 | |||
| Labour gain from Unionist | Swing | +4.2 | |||
| Party | Candidate | Votes | % | ±% | |
|---|---|---|---|---|---|
| Labour | Ernest Bennett | 14,469 | 39.1 | +5.3 | |
| Unionist | Lewis Lougher | 12,903 | 34.9 | −14.8 | |
| Liberal | Barnett Janner | 9,623 | 26.0 | ++9.5 | |
| Majority | 1,566 | 4.2 | 20.1 | ||
| Turnout | 78.2 | +1.4 | |||
| Labour gain from Unionist | Swing | +10.0 | |||
| Party | Candidate | Votes | % | ±% | |
|---|---|---|---|---|---|
| Labour | James Ewart Edmunds | 12,813 | 39.0 | +6.2 | |
| Liberal | John Emlyn-Jones | 10,500 | 31.9 | +5.0 | |
| Unionist | Clement Kinloch-Cooke | 9,563 | 29.1 | −11.1 | |
| Majority | 2,313 | 7.1 | 14.6 | ||
| Turnout | 82.1 | −0.2 | |||
| Labour gain from Unionist | Swing | +0.6 | |||
| Party | Candidate | Votes | % | ±% | |
|---|---|---|---|---|---|
| Labour | Morgan Jones | 21,248 | 57.9 | −1.1 | |
| Liberal | Alice Grace Roberts | 8,190 | 22.4 | n/a | |
| Unionist | Owen Temple-Morris | 6,357 | 17.4 | −23.6 | |
| Communist | J R Wilson | 829 | 2.3 | ||
| Majority | 13,058 | 35.5 | |||
| Turnout | 81.1 | +1.8 | |||
| Labour hold | Swing | n/a | |||
| Party | Candidate | Votes | % | ±% | |
|---|---|---|---|---|---|
| Labour | Arthur Henderson | 13,686 | 45.3 | +5.2 | |
| Unionist | Ernest Thomas Nethercoat | 10,030 | 33.1 | −17.0 | |
| Liberal | Charles James Cole | 6,550 | 21.6 | +11.8 | |
| Majority | 3,656 | 12.2 | 22.2 | ||
| Turnout | 79.4 | +0.6 | |||
| Labour gain from Unionist | Swing | +11.1 | |||
| Party | Candidate | Votes | % | ±% | |
|---|---|---|---|---|---|
| Liberal | Rhys Hopkin Morris | 17,127 | 60.6 | n/a | |
| Unionist | Edward Crawford Lloyd Fitzwilliams | 11,158 | 39.4 | n/a | |
| Majority | 5,969 | 21.1 | n/a | ||
| Turnout | 28,285 | 73.1 | n/a | ||
| Liberal hold | Swing | n/a | |||
| Party | Candidate | Votes | % | ±% | |
|---|---|---|---|---|---|
| Labour | Daniel Hopkin | 15,130 | 38.2 | +6.7 | |
| Liberal | William Nathaniel Jones | 14,477 | 36.6 | −31.9 | |
| Unionist | John Coventry | 9,961 | 25.2 | n/a | |
| Majority | 653 | 1.6 | −38.6 | ||
| Turnout | |||||
| Labour gain from Liberal | Swing | +19.3 | |||
| Party | Candidate | Votes | % | ±% | |
|---|---|---|---|---|---|
| Liberal | David Lloyd George | 16,647 | 58.0 | −24.4 | |
| Unionist | John Bowen Davies | 7,514 | 26.2 | n/a | |
| Labour | Thomas Ap Rhys | 4,536 | 15.8 | −1.7 | |
| Majority | 9,133 | 31.8 | −33.2 | ||
| Turnout | 28,697 | 81.8 | +4.8 | ||
| Liberal hold | Swing | n/a | |||
| Party | Candidate | Votes | % | ±% | |
|---|---|---|---|---|---|
| Liberal | Goronwy Owen | 18,507 | 47.9 | −2.9 | |
| Labour | Robert Jones | 14,867 | 38.5 | −10.7 | |
| Unionist | David Fowden Jones | 4,669 | 12.1 | n/a | |
| Plaid Cymru | Lewis Valentine | 609 | 1.6 | n/a | |
| Majority | 3,640 | 9.4 | +7.8 | ||
| Turnout | 38,652 | ||||
| Liberal hold | Swing | +3.9 | |||
| Party | Candidate | Votes | % | ±% | |
|---|---|---|---|---|---|
| Liberal | Henry Morris-Jones | 21,305 | 61.9 | +8.9 | |
| Unionist | Alan Graham | 13,116 | 38.1 | −8.9 | |
| Majority | 8,189 | 23.8 | +17.8 | ||
| Turnout | 79.7 | 0.0 | |||
| Liberal hold | Swing | +8.9 | |||
| Party | Candidate | Votes | % | ±% | |
|---|---|---|---|---|---|
| Labour | Aneurin Bevan | 20,088 | 60.3 | n/a | |
| Liberal | William Griffiths | 8,924 | 26.8 | n/a | |
| Unionist | Mark Brace | 4,287 | 12.9 | n/a | |
| Majority | 11,164 | 33.5 | n/a | ||
| Turnout | 33,299 | 85.9 | n/a | ||
| Labour hold | Swing | n/a | |||
| Party | Candidate | Votes | % | ±% | |
|---|---|---|---|---|---|
| Liberal | Frederick Llewellyn-Jones | 24,012 | 43.0 | +8.5 | |
| Unionist | Ernest Roberts | 19,536 | 35.0 | −11.4 | |
| Labour | Cyril Oswald Jones | 12,310 | 22.0 | +2.9 | |
| Majority | 4,476 | 8.0 | 19.9 | ||
| Turnout | 81.3 | +1.1 | |||
| Liberal gain from Unionist | Swing | +10.0 | |||
| Party | Candidate | Votes | % | ±% | |
|---|---|---|---|---|---|
| Labour | David Rhys Grenfell | 20,664 | 54.0 | ||
| Liberal | Frederick William Davies | 11,055 | 28.9 | n/a | |
| Unionist | Alan Lennox-Boyd | 6,554 | 17.1 | ||
| Majority | 9,609 | 25.1 | |||
| Turnout | 79.6 | ||||
| Labour hold | Swing | ||||
| Party | Candidate | Votes | % | ±% | |
|---|---|---|---|---|---|
| Labour | Charles Lloyd | 21,468 | 40.8 | ||
| Unionist | William Cope | 18,799 | 35.7 | ||
| Liberal | Ewan Davies | 12,352 | 23.5 | ||
| Majority | 2,669 | 5.1 | |||
| Turnout | 82.5 | ||||
| Labour gain from Unionist | Swing | ||||
| Party | Candidate | Votes | % | ±% | |
|---|---|---|---|---|---|
| Labour | John Henry Williams | 28,595 | 55.4 | +2.5 | |
| Liberal | Richard Thomas Evans | 19,075 | 36.9 | −10.2 | |
| Unionist | James Purdon Lewes Thomas | 3,969 | 7.7 | n/a | |
| Majority | 9,520 | 18.5 | +12.7 | ||
| Turnout | 79.1 | +3.4 | |||
| Labour hold | Swing | +6.3 | |||
| Party | Candidate | Votes | % | ±% | |
|---|---|---|---|---|---|
| Liberal | Henry Haydn Jones | 11,865 | 48.3 | +0.5 | |
| Labour | John Jones Roberts | 7,980 | 32.5 | −0.6 | |
| Unionist | Charles Phibbs | 4,731 | 19.3 | +0.2 | |
| Majority | 3,885 | 15.8 | +1.1 | ||
| Turnout | 24,576 | 85.2 | +1.3 | ||
| Liberal hold | Swing | +0.6 | |||
| Party | Candidate | Votes | % | ±% | |
|---|---|---|---|---|---|
| Labour | R. C. Wallhead | 22,701 | 59.6 | −0.2 | |
| Liberal | James Jenkins | 8,696 | 22.8 | n/a | |
| Unionist | Francis Bradley Bradley-Birt | 6,712 | 17.6 | −21.6 | |
| Majority | 14,005 | 36.8 | +17.2 | ||
| Turnout | 85.8 | −1.1 | |||
| Labour hold | Swing | n/a | |||
| Party | Candidate | Votes | % | ±% | |
|---|---|---|---|---|---|
| Unionist | Leolin Forestier-Walker | 16,353 | 49.3 | ||
| Liberal | Richard Charles Williams | 8,582 | 25.8 | n/a | |
| Labour | Luke Henry Bateman | 8,268 | 24.9 | ||
| Majority | 7,771 | 23.5 | −20.1 | ||
| Turnout | 78.9 | ||||
| Unionist hold | Swing | n/a | |||
| Party | Candidate | Votes | % | ±% | |
|---|---|---|---|---|---|
| Liberal | Clement Davies | 12,779 | 46.5 | −30.8 | |
| Unionist | John Murray Naylor | 10,651 | 38.7 | n/a | |
| Labour | John Evans | 4,069 | 14.8 | −7.9 | |
| Majority | 2,128 | 7.8 | −22.9 | ||
| Turnout | 88.3 | +8.9 | |||
| Liberal hold | Swing | -11.4 | |||
| Party | Candidate | Votes | % | ±% | |
|---|---|---|---|---|---|
| Labour | William Jenkins | 29,455 | 60.2 | n/a | |
| Liberal | Jack Jones | 14,554 | 29.8 | n/a | |
| Unionist | David J. Evans | 4,892 | 10.0 | n/a | |
| Majority | 14,901 | 30.4 | n/a | ||
| Turnout | 82.1 | n/a | |||
| Labour hold | Swing | n/a | |||
| Party | Candidate | Votes | % | ±% | |
|---|---|---|---|---|---|
| Labour | James Walker | 18,653 | 39.5 | −7.7 | |
| Unionist | Reginald Clarry | 15,841 | 33.5 | −19.3 | |
| Liberal | Samuel Immanuel Cohen | 12,735 | 27.0 | N/A | |
| Majority | 2,812 | 6.0 | +0.4 | ||
| Turnout | 83.8 | −1.9 | |||
| Labour gain from Unionist | Swing | +5.8 | |||
| Party | Candidate | Votes | % | ±% | |
|---|---|---|---|---|---|
| Labour | Vernon Hartshorn | 22,900 | 56.7 | n/a | |
| Liberal | Dapho Llewellyn Powell | 11,804 | 29.2 | n/a | |
| Unionist | H. Abbott | 4,164 | 10.3 | n/a | |
| Communist | J. R. Campbell | 1,525 | 3.8 | n/a | |
| Majority | 11,096 | 27.5 | n/a | ||
| Turnout | 82.8 | n/a | |||
| Labour hold | Swing | n/a | |||
| Party | Candidate | Votes | % | ±% | |
|---|---|---|---|---|---|
| Liberal | Gwilym Lloyd George | 19,050 | 41.8 | +5.6 | |
| Unionist | Charles Price | 14,235 | 31.3 | −9.1 | |
| Labour | William James Jenkins | 12,235 | 26.9 | +3.5 | |
| Majority | 4,815 | 10.6 | 14.8 | ||
| Turnout | 45,520 | ||||
| Liberal gain from Unionist | Swing | +7.4 | |||
| Party | Candidate | Votes | % | ±% | |
|---|---|---|---|---|---|
| Labour | Thomas Griffiths | 17,805 | 51.5 | ||
| Liberal | Geoffrey Crawshay | 12,581 | 36.4 | n/a | |
| Unionist | Gwilym Rowlands | 4,188 | 12.1 | ||
| Majority | 5,224 | 15.1 | |||
| Turnout | 34,574 | ||||
| Labour hold | Swing | ||||
| Party | Candidate | Votes | % | ±% | |
|---|---|---|---|---|---|
| Labour | Thomas Isaac Mardy Jones | 20,835 | 53.12 | −2.8 | |
| Liberal | John Victor Evans | 14,421 | 36.8 | n/a | |
| Unionist | May Gordon Williams | 3,967 | 10.1 | −34.0 | |
| Majority | 6,414 | 16.4 | +4.5 | ||
| Turnout | 39,223 | 82.0 | +2.3 | ||
| Labour hold | Swing | n/a | |||
| Party | Candidate | Votes | % | ±% | |
|---|---|---|---|---|---|
| Labour | David Watts Morgan | 19,010 | 50.2 | n/a | |
| Liberal | Richard David Chalke | 10,269 | 27.0 | n/a | |
| Communist | Arthur Horner | 5,789 | 15.2 | n/a | |
| Unionist | John Francis Powell | 2,901 | 7.6 | n/a | |
| Majority | 8,741 | 23.2 | n/a | ||
| Turnout | 84.7 | n/a | |||
| Labour hold | Swing | n/a | |||
| Party | Candidate | Votes | % | ±% | |
|---|---|---|---|---|---|
| Labour | William John | 23,238 | 65.1 | n/a | |
| Liberal | Moelwyn Hughes | 9,247 | 25.9 | n/a | |
| Unionist | Wilfred Augustus Prichard | 3,210 | 9.0 | n/a | |
| Majority | 13,991 | 39.2 | n/a | ||
| Turnout | 35,695 | 86.7 | n/a | ||
| Labour hold | Swing | ||||
| Party | Candidate | Votes | % | ±% | |
|---|---|---|---|---|---|
| Labour | David Williams | 16,665 | 56.5 | +1.9 | |
| Liberal | Arthur Hopkins | 9,825 | 33.3 | −12.1 | |
| Unionist | P.P. Jones | 3,003 | 10.2 | n/a | |
| Majority | 6,840 | 23.2 | +14.0 | ||
| Turnout | 81.9 | +1.2 | |||
| Labour hold | Swing | +7.0 | |||
| Party | Candidate | Votes | % | ±% | |
|---|---|---|---|---|---|
| Labour | Howel Samuel | 13,268 | 40.6 | +7.2 | |
| Liberal | Charles Kerr | 12,625 | 38.6 | +2.2 | |
| Unionist | Alfred William Ernest Wynne | 6,794 | 20.8 | −9.4 | |
| Majority | 643 | 2.0 | 5.0 | ||
| Turnout | 81.7 | −5.3 | |||
| Labour gain from Liberal | Swing | +2.5 | |||
| Party | Candidate | Votes | % | ±% | |
|---|---|---|---|---|---|
| Labour | Robert Richards | 20,584 | 46.4 | +2.0 | |
| Liberal | Christmas Price Williams | 13,997 | 31.5 | −24.1 | |
| Unionist | Edmund Fleming Bushby | 9,820 | 22.1 | n/a | |
| Majority | 6,587 | 14.9 | 26.1 | ||
| Turnout | 84.9 | +2.3 | |||
| Labour gain from Liberal | Swing | +13.0 | |||