1972 United States presidential election in North Carolina|
|
| Turnout | 64.41%[1] |
|---|
|
|
 County results
 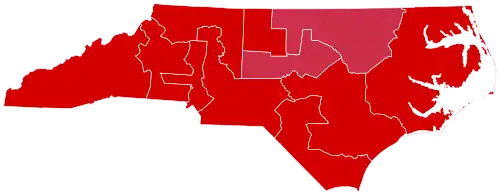 Congressional district results
|
Nixon
50–60%
60–70%
70–80%
80–90%
|
McGovern
50–60%
| |
|
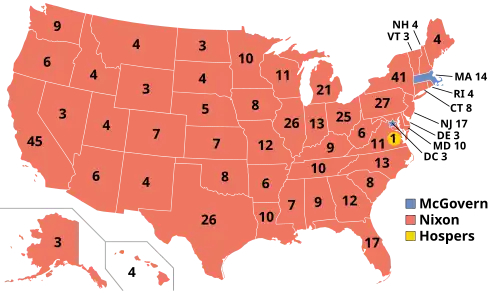
The 1972 United States presidential election in North Carolina took place on November 7, 1972, as part of the 1972 United States presidential election. Voters chose 13 representatives, or electors to the Electoral College, who voted for president and vice president.
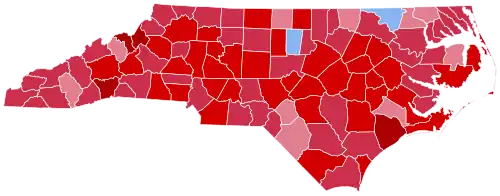
Amidst a nationwide landslide defeat especially felt in the South, McGovern won only two counties in North Carolina, neither of which have voted for a Republican presidential candidate since the Fourth Party System era: Orange County in the Research Triangle region, home of the University of North Carolina at Chapel Hill, and majority-Black Northampton County in the northeast of the state.[2] Even in these counties, where most Democratic candidates receive over sixty percent of the vote (and where Walter Mondale in 1984 would still win by double digits), McGovern won by less than five points.[3] Among white voters, 78% supported Nixon, while only 20% supported McGovern.
Primaries
Democratic
1972 North Carolina Democratic Party presidential primary|
|
|
|
 County Results
|
Wallace
40-50%
50-60%
60-70%
70-80%
|
Sanford
40-50%
50-60%
60-70%
| |
Alabama Governor, George Wallace, would defeat favorite son candidate, Terry Sanford.[6]
Republican
Campaign
Polls
Results
By county
| County[12]
|
Richard Nixon
Republican
|
George McGovern
Democratic
|
John G. Schmitz
American
|
Margin
|
Total
|
| #
|
%
|
#
|
%
|
#
|
%
|
#
|
%
|
| Alamance
|
22,046
|
74.61%
|
6,833
|
23.12%
|
670
|
2.27%
|
15,213
|
51.49%
|
29,549
|
| Alexander
|
5,865
|
68.95%
|
2,468
|
29.01%
|
173
|
2.04%
|
3,397
|
39.94%
|
8,506
|
| Alleghany
|
2,158
|
61.29%
|
1,304
|
37.03%
|
59
|
1.68%
|
854
|
24.26%
|
3,521
|
| Anson
|
3,551
|
60.88%
|
2,188
|
37.51%
|
94
|
1.61%
|
1,363
|
23.37%
|
5,833
|
| Ashe
|
5,784
|
62.95%
|
3,313
|
36.06%
|
91
|
0.99%
|
2,471
|
26.89%
|
9,188
|
| Avery
|
3,510
|
83.99%
|
627
|
15.00%
|
42
|
1.01%
|
2,883
|
68.99%
|
4,179
|
| Beaufort
|
6,915
|
69.65%
|
2,901
|
29.22%
|
112
|
1.13%
|
4,014
|
40.43%
|
9,928
|
| Bertie
|
2,874
|
60.54%
|
1,819
|
38.32%
|
54
|
1.14%
|
1,055
|
22.22%
|
4,747
|
| Bladen
|
4,205
|
64.72%
|
2,201
|
33.88%
|
91
|
1.40%
|
2,004
|
30.84%
|
6,497
|
| Brunswick
|
6,153
|
69.06%
|
2,500
|
28.06%
|
256
|
2.88%
|
3,653
|
41.00%
|
8,909
|
| Buncombe
|
32,091
|
70.38%
|
12,626
|
27.69%
|
877
|
1.93%
|
19,465
|
42.69%
|
45,594
|
| Burke
|
14,447
|
68.96%
|
6,197
|
29.58%
|
306
|
1.46%
|
8,250
|
39.38%
|
20,950
|
| Cabarrus
|
18,384
|
76.45%
|
5,336
|
22.19%
|
328
|
1.36%
|
13,048
|
54.26%
|
24,048
|
| Caldwell
|
12,976
|
71.41%
|
4,886
|
26.89%
|
309
|
1.70%
|
8,090
|
44.52%
|
18,171
|
| Camden
|
909
|
60.20%
|
556
|
36.82%
|
45
|
2.98%
|
353
|
23.38%
|
1,510
|
| Carteret
|
8,463
|
74.14%
|
2,805
|
24.57%
|
147
|
1.29%
|
5,658
|
49.57%
|
11,415
|
| Caswell
|
2,983
|
59.65%
|
1,922
|
38.43%
|
96
|
1.92%
|
1,061
|
21.22%
|
5,001
|
| Catawba
|
24,106
|
74.46%
|
7,744
|
23.92%
|
525
|
1.62%
|
16,362
|
50.54%
|
32,375
|
| Chatham
|
6,175
|
62.12%
|
3,624
|
36.46%
|
142
|
1.42%
|
2,551
|
25.66%
|
9,941
|
| Cherokee
|
4,113
|
62.28%
|
2,411
|
36.51%
|
80
|
1.21%
|
1,702
|
25.77%
|
6,604
|
| Chowan
|
1,906
|
66.39%
|
936
|
32.60%
|
29
|
1.01%
|
970
|
33.79%
|
2,871
|
| Clay
|
1,545
|
65.19%
|
797
|
33.63%
|
28
|
1.18%
|
748
|
31.56%
|
2,370
|
| Cleveland
|
13,726
|
72.06%
|
4,994
|
26.22%
|
328
|
1.72%
|
8,732
|
45.84%
|
19,048
|
| Columbus
|
8,468
|
70.64%
|
3,305
|
27.57%
|
214
|
1.79%
|
5,163
|
43.07%
|
11,987
|
| Craven
|
9,372
|
78.74%
|
2,384
|
20.03%
|
147
|
1.23%
|
6,988
|
58.71%
|
11,903
|
| Cumberland
|
24,376
|
70.46%
|
9,853
|
28.48%
|
366
|
1.06%
|
14,523
|
41.98%
|
34,595
|
| Currituck
|
1,578
|
66.67%
|
718
|
30.33%
|
71
|
3.00%
|
860
|
36.34%
|
2,367
|
| Dare
|
1,986
|
75.20%
|
634
|
24.01%
|
21
|
0.79%
|
1,352
|
51.19%
|
2,641
|
| Davidson
|
24,875
|
74.79%
|
7,691
|
23.12%
|
696
|
2.09%
|
17,184
|
51.67%
|
33,262
|
| Davie
|
5,613
|
75.69%
|
1,578
|
21.28%
|
225
|
3.03%
|
4,035
|
54.41%
|
7,416
|
| Duplin
|
7,153
|
70.61%
|
2,857
|
28.20%
|
120
|
1.19%
|
4,296
|
42.41%
|
10,130
|
| Durham
|
25,576
|
61.38%
|
15,566
|
37.36%
|
525
|
1.26%
|
10,010
|
24.02%
|
41,667
|
| Edgecombe
|
8,244
|
62.53%
|
4,635
|
35.16%
|
305
|
2.31%
|
3,609
|
27.37%
|
13,184
|
| Forsyth
|
46,415
|
67.69%
|
20,928
|
30.52%
|
1,226
|
1.79%
|
25,487
|
37.17%
|
68,569
|
| Franklin
|
5,431
|
68.37%
|
2,341
|
29.47%
|
172
|
2.16%
|
3,090
|
38.90%
|
7,944
|
| Gaston
|
27,956
|
75.76%
|
8,462
|
22.93%
|
483
|
1.31%
|
19,494
|
52.83%
|
36,901
|
| Gates
|
1,264
|
51.01%
|
1,177
|
47.50%
|
37
|
1.49%
|
87
|
3.51%
|
2,478
|
| Graham
|
1,699
|
61.05%
|
1,057
|
37.98%
|
27
|
0.97%
|
642
|
23.07%
|
2,783
|
| Granville
|
6,037
|
66.82%
|
2,918
|
32.30%
|
80
|
0.88%
|
3,119
|
34.52%
|
9,035
|
| Greene
|
2,788
|
75.68%
|
847
|
22.99%
|
49
|
1.33%
|
1,941
|
52.69%
|
3,684
|
| Guilford
|
61,381
|
69.46%
|
25,800
|
29.20%
|
1,185
|
1.34%
|
35,581
|
40.26%
|
88,366
|
| Halifax
|
8,908
|
66.60%
|
4,241
|
31.71%
|
226
|
1.69%
|
4,667
|
34.89%
|
13,375
|
| Harnett
|
10,259
|
74.64%
|
3,347
|
24.35%
|
138
|
1.01%
|
6,912
|
50.29%
|
13,744
|
| Haywood
|
8,903
|
64.84%
|
4,515
|
32.88%
|
313
|
2.28%
|
4,388
|
31.96%
|
13,731
|
| Henderson
|
12,134
|
80.17%
|
2,701
|
17.85%
|
300
|
1.98%
|
9,433
|
62.32%
|
15,135
|
| Hertford
|
2,794
|
58.34%
|
1,928
|
40.26%
|
67
|
1.40%
|
866
|
18.08%
|
4,789
|
| Hoke
|
1,927
|
56.25%
|
1,466
|
42.79%
|
33
|
0.96%
|
461
|
13.46%
|
3,426
|
| Hyde
|
1,112
|
69.28%
|
403
|
25.11%
|
90
|
5.61%
|
709
|
44.17%
|
1,605
|
| Iredell
|
16,736
|
73.79%
|
5,088
|
22.43%
|
858
|
3.78%
|
11,648
|
51.36%
|
22,682
|
| Jackson
|
4,709
|
59.11%
|
3,169
|
39.78%
|
89
|
1.11%
|
1,540
|
19.33%
|
7,967
|
| Johnston
|
14,272
|
79.24%
|
3,488
|
19.37%
|
251
|
1.39%
|
10,784
|
59.87%
|
18,011
|
| Jones
|
1,650
|
58.93%
|
1,093
|
39.04%
|
57
|
2.03%
|
557
|
19.89%
|
2,800
|
| Lee
|
5,836
|
72.71%
|
2,024
|
25.22%
|
166
|
2.07%
|
3,812
|
47.49%
|
8,026
|
| Lenoir
|
11,065
|
73.89%
|
3,672
|
24.52%
|
238
|
1.59%
|
7,393
|
49.37%
|
14,975
|
| Lincoln
|
8,597
|
61.88%
|
5,100
|
36.71%
|
195
|
1.41%
|
3,497
|
25.17%
|
13,892
|
| Macon
|
4,134
|
69.20%
|
1,749
|
29.28%
|
91
|
1.52%
|
2,385
|
39.92%
|
5,974
|
| Madison
|
3,273
|
61.18%
|
2,039
|
38.11%
|
38
|
0.71%
|
1,234
|
23.07%
|
5,350
|
| Martin
|
4,188
|
68.76%
|
1,840
|
30.21%
|
63
|
1.03%
|
2,348
|
38.55%
|
6,091
|
| McDowell
|
6,570
|
72.09%
|
2,348
|
25.76%
|
196
|
2.15%
|
4,222
|
46.33%
|
9,114
|
| Mecklenburg
|
77,546
|
68.52%
|
33,730
|
29.80%
|
1,900
|
1.68%
|
43,816
|
38.72%
|
113,176
|
| Mitchell
|
4,240
|
83.45%
|
800
|
15.74%
|
41
|
0.81%
|
3,440
|
67.71%
|
5,081
|
| Montgomery
|
4,417
|
65.67%
|
2,175
|
32.34%
|
134
|
1.99%
|
2,242
|
33.33%
|
6,726
|
| Moore
|
9,406
|
70.68%
|
3,627
|
27.25%
|
275
|
2.07%
|
5,779
|
43.43%
|
13,308
|
| Nash
|
12,679
|
71.39%
|
4,503
|
25.35%
|
579
|
3.26%
|
8,176
|
46.04%
|
17,761
|
| New Hanover
|
19,060
|
74.41%
|
5,894
|
23.01%
|
661
|
2.58%
|
13,166
|
51.40%
|
25,615
|
| Northampton
|
2,997
|
47.71%
|
3,233
|
51.46%
|
52
|
0.83%
|
−236
|
−3.75%
|
6,282
|
| Onslow
|
10,343
|
80.05%
|
2,424
|
18.76%
|
154
|
1.19%
|
7,919
|
61.29%
|
12,921
|
| Orange
|
11,632
|
47.66%
|
12,634
|
51.76%
|
142
|
0.58%
|
−1,002
|
−4.10%
|
24,408
|
| Pamlico
|
1,847
|
66.11%
|
919
|
32.89%
|
28
|
1.00%
|
928
|
33.22%
|
2,794
|
| Pasquotank
|
3,906
|
63.07%
|
2,115
|
34.15%
|
172
|
2.78%
|
1,791
|
28.92%
|
6,193
|
| Pender
|
3,327
|
68.90%
|
1,415
|
29.30%
|
87
|
1.80%
|
1,912
|
39.60%
|
4,829
|
| Perquimans
|
1,299
|
62.57%
|
723
|
34.83%
|
54
|
2.60%
|
576
|
27.74%
|
2,076
|
| Person
|
5,941
|
71.89%
|
2,246
|
27.18%
|
77
|
0.93%
|
3,695
|
44.71%
|
8,264
|
| Pitt
|
14,406
|
70.41%
|
5,858
|
28.63%
|
195
|
0.96%
|
8,548
|
41.78%
|
20,459
|
| Polk
|
3,121
|
67.31%
|
1,416
|
30.54%
|
100
|
2.15%
|
1,705
|
36.77%
|
4,637
|
| Randolph
|
18,724
|
76.02%
|
5,346
|
21.71%
|
559
|
2.27%
|
13,378
|
54.31%
|
24,629
|
| Richmond
|
5,692
|
60.84%
|
3,508
|
37.49%
|
156
|
1.67%
|
2,184
|
23.35%
|
9,356
|
| Robeson
|
11,362
|
59.99%
|
7,391
|
39.02%
|
188
|
0.99%
|
3,971
|
20.97%
|
18,941
|
| Rockingham
|
14,519
|
71.15%
|
5,530
|
27.10%
|
358
|
1.75%
|
8,989
|
44.05%
|
20,407
|
| Rowan
|
20,735
|
73.34%
|
6,834
|
24.17%
|
705
|
2.49%
|
13,901
|
49.17%
|
28,274
|
| Rutherford
|
9,506
|
68.80%
|
4,140
|
29.97%
|
170
|
1.23%
|
5,366
|
38.83%
|
13,816
|
| Sampson
|
9,684
|
65.76%
|
4,888
|
33.19%
|
154
|
1.05%
|
4,796
|
32.57%
|
14,726
|
| Scotland
|
3,485
|
63.69%
|
1,938
|
35.42%
|
49
|
0.89%
|
1,547
|
28.27%
|
5,472
|
| Stanly
|
12,459
|
69.32%
|
5,218
|
29.03%
|
295
|
1.65%
|
7,241
|
40.29%
|
17,972
|
| Stokes
|
7,118
|
66.86%
|
3,254
|
30.57%
|
274
|
2.57%
|
3,864
|
36.29%
|
10,646
|
| Surry
|
10,497
|
67.78%
|
4,706
|
30.39%
|
284
|
1.83%
|
5,791
|
37.39%
|
15,487
|
| Swain
|
2,052
|
64.45%
|
1,101
|
34.58%
|
31
|
0.97%
|
951
|
29.87%
|
3,184
|
| Transylvania
|
5,860
|
69.73%
|
2,321
|
27.62%
|
223
|
2.65%
|
3,539
|
42.11%
|
8,404
|
| Tyrrell
|
676
|
59.30%
|
459
|
40.26%
|
5
|
0.44%
|
217
|
19.04%
|
1,140
|
| Union
|
10,264
|
71.60%
|
3,886
|
27.11%
|
186
|
1.29%
|
6,378
|
44.49%
|
14,336
|
| Vance
|
6,491
|
66.85%
|
3,117
|
32.10%
|
102
|
1.05%
|
3,374
|
34.75%
|
9,710
|
| Wake
|
56,808
|
70.32%
|
22,807
|
28.23%
|
1,174
|
1.45%
|
34,001
|
42.09%
|
80,789
|
| Warren
|
2,603
|
59.62%
|
1,698
|
38.89%
|
65
|
1.49%
|
905
|
20.73%
|
4,366
|
| Washington
|
2,559
|
61.65%
|
1,546
|
37.24%
|
46
|
1.11%
|
1,013
|
24.41%
|
4,151
|
| Watauga
|
6,017
|
62.85%
|
3,451
|
36.05%
|
105
|
1.10%
|
2,566
|
26.80%
|
9,573
|
| Wayne
|
14,352
|
72.33%
|
5,234
|
26.38%
|
256
|
1.29%
|
9,118
|
45.95%
|
19,842
|
| Wilkes
|
13,105
|
72.83%
|
4,634
|
25.75%
|
255
|
1.42%
|
8,471
|
47.08%
|
17,994
|
| Wilson
|
12,060
|
73.04%
|
4,166
|
25.23%
|
286
|
1.73%
|
7,894
|
47.81%
|
16,512
|
| Yadkin
|
6,824
|
79.16%
|
1,592
|
18.47%
|
205
|
2.37%
|
5,232
|
60.69%
|
8,621
|
| Yancey
|
3,106
|
57.10%
|
2,278
|
41.88%
|
56
|
1.02%
|
828
|
15.22%
|
5,440
|
| Totals |
1,054,889 |
69.46% |
438,705 |
28.89% |
25,018 |
1.65% |
616,184 |
40.57% |
1,518,612
|
Notes
- ^ These write-in votes were not separated by county but given only as a state-wide total.[12]
References
- ^ "Voter Turnout". North Carolina State Board of Elections.
- ^ Sullivan, Robert David; ‘How the Red and Blue Map Evolved Over the Past Century’; America Magazine in The National Catholic Review; June 29, 2016.
- ^ David Leip’s Atlas of U.S. Presidential Elections; 1984 Presidential General Election Data Graphs – North Carolina
- ^ "Our Campaigns - NC US President - D Primary Race - May 06, 1972".
- ^ "Nixon May Sweep Dixie States". Corvallis Gazette-Times. Corvallis, Oregon. September 19, 1972. p. 24.
- ^ Phillips, Kevin P. (October 9, 1972). "Dixie May Swing Political Future". The Bradenton Herald. Bradenton, Florida. p. 7-B.
- ^
- ^ "Nixon Expected To Sweep South". Sun Herald. Biloxi, Mississippi. November 5, 1972. p. C-9.
- ^ "1972 Presidential General Election Data Graphs – North Carolina". David Leip’s Atlas of U.S. Presidential Elections.
- ^ a b Our Campaigns; NC US President Race, November 07, 1972
Works cited
.jpg)
_(3x4-1).jpg)
_(3x4).jpg)