1964 United States presidential election in North Carolina|
|
| Turnout | 74%  |
|---|
|
|
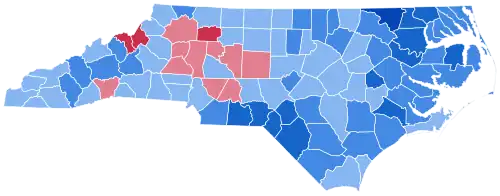 County results
  Congressional district results
|
Johnson
50–60%
60–70%
70–80%
80–90%
|
Goldwater
50–60%
60–70%
| |
|
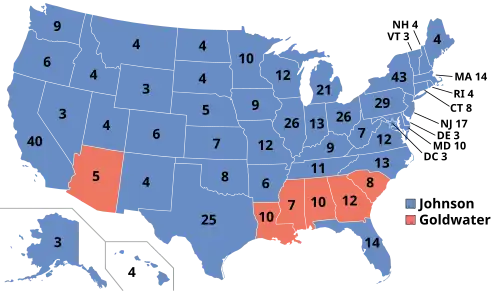
The 1964 United States presidential election in North Carolina took place on November 3, 1964, and was part of the 1964 United States presidential election. Voters chose 13 representatives, or electors, to the Electoral College, who voted for president and vice president.
Polling initially showed Goldwater leading in North Carolina, but his farm policies, particularly his opposition to federal tobacco price support, hurt his campaign. As of the 2024 presidential election, this is the last election when the following counties voted for a Democratic presidential candidate: Wayne, Moore, and Lenoir.[2]
Results
Results by county
| County[4]
|
Lyndon B. Johnson
Democratic
|
Barry Goldwater
Republican[5]
|
Margin
|
Total
|
| #
|
%
|
#
|
%
|
#
|
%
|
| Alamance
|
15,397
|
50.36%
|
15,177
|
49.64%
|
220
|
0.72%
|
30,574
|
| Alexander
|
3,722
|
49.75%
|
3,760
|
50.25%
|
−38
|
−0.50%
|
7,482
|
| Alleghany
|
2,368
|
60.09%
|
1,573
|
39.91%
|
795
|
20.18%
|
3,941
|
| Anson
|
4,144
|
70.66%
|
1,721
|
29.34%
|
2,423
|
41.32%
|
5,865
|
| Ashe
|
4,965
|
54.23%
|
4,191
|
45.77%
|
774
|
8.45%
|
9,156
|
| Avery
|
1,523
|
36.44%
|
2,656
|
63.56%
|
−1,133
|
−27.12%
|
4,179
|
| Beaufort
|
6,090
|
62.88%
|
3,595
|
37.12%
|
2,495
|
25.76%
|
9,685
|
| Bertie
|
3,332
|
78.16%
|
931
|
21.84%
|
2,401
|
56.32%
|
4,263
|
| Bladen
|
4,516
|
67.55%
|
2,169
|
32.45%
|
2,347
|
35.10%
|
6,685
|
| Brunswick
|
4,240
|
53.26%
|
3,721
|
46.74%
|
519
|
6.52%
|
7,961
|
| Buncombe
|
31,623
|
62.01%
|
19,372
|
37.99%
|
12,251
|
24.02%
|
50,995
|
| Burke
|
12,815
|
55.97%
|
10,081
|
44.03%
|
2,734
|
11.94%
|
22,896
|
| Cabarrus
|
11,921
|
47.50%
|
13,178
|
52.50%
|
−1,257
|
−5.00%
|
25,099
|
| Caldwell
|
10,846
|
55.40%
|
8,733
|
44.60%
|
2,113
|
10.80%
|
19,579
|
| Camden
|
870
|
61.97%
|
534
|
38.03%
|
336
|
23.94%
|
1,404
|
| Carteret
|
6,231
|
59.23%
|
4,289
|
40.77%
|
1,942
|
18.46%
|
10,520
|
| Caswell
|
2,513
|
58.36%
|
1,793
|
41.64%
|
720
|
16.72%
|
4,306
|
| Catawba
|
15,814
|
48.02%
|
17,116
|
51.98%
|
−1,302
|
−3.96%
|
32,930
|
| Chatham
|
5,295
|
56.29%
|
4,111
|
43.71%
|
1,184
|
12.58%
|
9,406
|
| Cherokee
|
3,823
|
55.17%
|
3,106
|
44.83%
|
717
|
10.35%
|
6,929
|
| Chowan
|
1,696
|
68.30%
|
787
|
31.70%
|
909
|
36.60%
|
2,483
|
| Clay
|
1,457
|
53.12%
|
1,286
|
46.88%
|
171
|
6.24%
|
2,743
|
| Cleveland
|
10,836
|
57.92%
|
7,874
|
42.08%
|
2,962
|
15.84%
|
18,710
|
| Columbus
|
9,004
|
66.82%
|
4,471
|
33.18%
|
4,533
|
33.64%
|
13,475
|
| Craven
|
7,422
|
61.27%
|
4,691
|
38.73%
|
2,731
|
22.54%
|
12,113
|
| Cumberland
|
13,864
|
60.39%
|
9,093
|
39.61%
|
4,771
|
20.78%
|
22,957
|
| Currituck
|
1,455
|
66.26%
|
741
|
33.74%
|
714
|
32.52%
|
2,196
|
| Dare
|
1,476
|
63.00%
|
867
|
37.00%
|
609
|
26.00%
|
2,343
|
| Davidson
|
13,735
|
44.27%
|
17,292
|
55.73%
|
−3,557
|
−11.46%
|
31,027
|
| Davie
|
3,086
|
40.90%
|
4,460
|
59.10%
|
−1,374
|
−18.20%
|
7,546
|
| Duplin
|
7,169
|
65.23%
|
3,821
|
34.77%
|
3,348
|
30.46%
|
10,990
|
| Durham
|
22,874
|
59.98%
|
15,264
|
40.02%
|
7,610
|
19.96%
|
38,138
|
| Edgecombe
|
7,834
|
66.58%
|
3,932
|
33.42%
|
3,902
|
33.16%
|
11,766
|
| Forsyth
|
31,615
|
51.08%
|
30,276
|
48.92%
|
1,339
|
2.16%
|
61,891
|
| Franklin
|
4,554
|
68.47%
|
2,097
|
31.53%
|
2,457
|
36.94%
|
6,651
|
| Gaston
|
20,197
|
54.11%
|
17,129
|
45.89%
|
3,068
|
8.22%
|
37,326
|
| Gates
|
1,702
|
75.38%
|
556
|
24.62%
|
1,146
|
50.76%
|
2,258
|
| Graham
|
1,737
|
55.41%
|
1,398
|
44.59%
|
339
|
10.82%
|
3,135
|
| Granville
|
4,596
|
63.66%
|
2,624
|
36.34%
|
1,972
|
27.32%
|
7,220
|
| Greene
|
2,712
|
75.06%
|
901
|
24.94%
|
1,811
|
50.12%
|
3,613
|
| Guilford
|
39,969
|
52.87%
|
35,635
|
47.13%
|
4,334
|
5.74%
|
75,604
|
| Halifax
|
8,952
|
65.30%
|
4,757
|
34.70%
|
4,195
|
30.60%
|
13,709
|
| Harnett
|
7,477
|
55.97%
|
5,883
|
44.03%
|
1,594
|
11.94%
|
13,360
|
| Haywood
|
10,664
|
65.67%
|
5,575
|
34.33%
|
5,089
|
31.34%
|
16,239
|
| Henderson
|
6,066
|
40.86%
|
8,780
|
59.14%
|
−2,714
|
−18.28%
|
14,846
|
| Hertford
|
3,953
|
79.91%
|
994
|
20.09%
|
2,959
|
59.82%
|
4,947
|
| Hoke
|
2,254
|
74.32%
|
779
|
25.68%
|
1,475
|
48.64%
|
3,033
|
| Hyde
|
1,127
|
68.68%
|
514
|
31.32%
|
613
|
37.36%
|
1,641
|
| Iredell
|
11,231
|
46.56%
|
12,892
|
53.44%
|
−1,661
|
−6.88%
|
24,123
|
| Jackson
|
4,905
|
60.65%
|
3,183
|
39.35%
|
1,722
|
21.30%
|
8,088
|
| Johnston
|
10,326
|
57.85%
|
7,523
|
42.15%
|
2,803
|
15.70%
|
17,849
|
| Jones
|
2,129
|
73.29%
|
776
|
26.71%
|
1,353
|
46.58%
|
2,905
|
| Lee
|
4,730
|
63.21%
|
2,753
|
36.79%
|
1,977
|
26.42%
|
7,483
|
| Lenoir
|
7,617
|
57.56%
|
5,617
|
42.44%
|
2,000
|
15.12%
|
13,234
|
| Lincoln
|
7,304
|
55.45%
|
5,869
|
44.55%
|
1,435
|
10.90%
|
13,173
|
| Macon
|
3,774
|
56.55%
|
2,900
|
43.45%
|
874
|
13.10%
|
6,674
|
| Madison
|
3,829
|
53.44%
|
3,336
|
46.56%
|
493
|
6.88%
|
7,165
|
| Martin
|
4,821
|
76.14%
|
1,511
|
23.86%
|
3,310
|
52.28%
|
6,332
|
| McDowell
|
6,314
|
60.20%
|
4,174
|
39.80%
|
2,140
|
20.40%
|
10,488
|
| Mecklenburg
|
49,582
|
51.56%
|
46,589
|
48.44%
|
2,993
|
3.12%
|
96,171
|
| Mitchell
|
1,736
|
34.73%
|
3,263
|
65.27%
|
−1,527
|
−30.54%
|
4,999
|
| Montgomery
|
3,933
|
53.74%
|
3,385
|
46.26%
|
548
|
7.48%
|
7,318
|
| Moore
|
6,384
|
55.29%
|
5,162
|
44.71%
|
1,222
|
10.58%
|
11,546
|
| Nash
|
9,163
|
58.89%
|
6,396
|
41.11%
|
2,767
|
17.78%
|
15,559
|
| New Hanover
|
12,584
|
50.90%
|
12,140
|
49.10%
|
444
|
1.80%
|
24,724
|
| Northampton
|
5,046
|
80.96%
|
1,187
|
19.04%
|
3,859
|
61.92%
|
6,233
|
| Onslow
|
5,955
|
61.23%
|
3,771
|
38.77%
|
2,184
|
22.46%
|
9,726
|
| Orange
|
9,206
|
61.41%
|
5,785
|
38.59%
|
3,421
|
22.82%
|
14,991
|
| Pamlico
|
1,864
|
64.28%
|
1,036
|
35.72%
|
828
|
28.55%
|
2,900
|
| Pasquotank
|
4,269
|
64.21%
|
2,380
|
35.79%
|
1,889
|
28.42%
|
6,649
|
| Pender
|
3,205
|
62.04%
|
1,961
|
37.96%
|
1,244
|
24.08%
|
5,166
|
| Perquimans
|
1,458
|
60.78%
|
941
|
39.22%
|
517
|
21.56%
|
2,399
|
| Person
|
4,740
|
68.68%
|
2,162
|
31.32%
|
2,578
|
37.36%
|
6,902
|
| Pitt
|
11,317
|
68.73%
|
5,149
|
31.27%
|
6,168
|
37.46%
|
16,466
|
| Polk
|
3,017
|
52.18%
|
2,765
|
47.82%
|
252
|
4.36%
|
5,782
|
| Randolph
|
10,638
|
43.64%
|
13,739
|
56.36%
|
−3,101
|
−12.72%
|
24,377
|
| Richmond
|
8,516
|
73.17%
|
3,123
|
26.83%
|
5,393
|
46.34%
|
11,639
|
| Robeson
|
13,796
|
79.35%
|
3,591
|
20.65%
|
10,205
|
58.70%
|
17,387
|
| Rockingham
|
11,432
|
55.78%
|
9,063
|
44.22%
|
2,369
|
11.56%
|
20,495
|
| Rowan
|
14,934
|
50.22%
|
14,804
|
49.78%
|
130
|
0.44%
|
29,738
|
| Rutherford
|
9,541
|
57.28%
|
7,115
|
42.72%
|
2,426
|
14.56%
|
16,656
|
| Sampson
|
8,067
|
51.38%
|
7,634
|
48.62%
|
433
|
2.76%
|
15,701
|
| Scotland
|
3,844
|
75.77%
|
1,229
|
24.23%
|
2,615
|
51.54%
|
5,073
|
| Stanly
|
7,931
|
47.05%
|
8,924
|
52.95%
|
−993
|
−5.90%
|
16,855
|
| Stokes
|
4,898
|
51.22%
|
4,664
|
48.78%
|
234
|
2.44%
|
9,562
|
| Surry
|
9,810
|
55.17%
|
7,970
|
44.83%
|
1,840
|
10.34%
|
17,780
|
| Swain
|
2,294
|
59.93%
|
1,534
|
40.07%
|
760
|
19.86%
|
3,828
|
| Transylvania
|
4,483
|
55.83%
|
3,547
|
44.17%
|
936
|
11.66%
|
8,030
|
| Tyrrell
|
996
|
72.70%
|
374
|
27.30%
|
622
|
45.40%
|
1,370
|
| Union
|
7,208
|
63.02%
|
4,229
|
36.98%
|
2,979
|
26.04%
|
11,437
|
| Vance
|
5,186
|
60.04%
|
3,452
|
39.96%
|
1,734
|
20.08%
|
8,638
|
| Wake
|
31,653
|
58.41%
|
22,542
|
41.59%
|
9,111
|
16.82%
|
54,195
|
| Warren
|
2,849
|
59.88%
|
1,909
|
40.12%
|
940
|
19.76%
|
4,758
|
| Washington
|
2,505
|
68.65%
|
1,144
|
31.35%
|
1,361
|
37.30%
|
3,649
|
| Watauga
|
4,031
|
50.62%
|
3,932
|
49.38%
|
99
|
1.24%
|
7,963
|
| Wayne
|
9,791
|
56.45%
|
7,555
|
43.55%
|
2,236
|
12.90%
|
17,346
|
| Wilkes
|
9,176
|
45.45%
|
11,014
|
54.55%
|
−1,838
|
−9.10%
|
20,190
|
| Wilson
|
7,238
|
59.13%
|
5,002
|
40.87%
|
2,236
|
18.26%
|
12,240
|
| Yadkin
|
3,638
|
38.30%
|
5,860
|
61.70%
|
−2,222
|
−23.40%
|
9,498
|
| Yancey
|
3,714
|
64.95%
|
2,004
|
35.05%
|
1,710
|
29.90%
|
5,718
|
| Totals |
800,139 |
56.15% |
624,844 |
43.85% |
175,295 |
12.30% |
1,424,983
|
Results by congressional district
Johnson carried 8 of the 9 congressional districts, including one that elected a Republican.
| District[6]
|
Goldwater
|
Johnson
|
| 1st
|
30.9%
|
69.1%
|
| 2nd
|
35.7%
|
64.3%
|
| 3rd
|
41.1%
|
58.9%
|
| 4th
|
47%
|
53%
|
| 5th
|
46.9%
|
53.1%
|
| 6th
|
45.1%
|
54.9%
|
| 7th
|
36.7%
|
63.3%
|
| 8th
|
44.2%
|
55.8%
|
| 9th
|
51.1%
|
48.9%
|
| 10th
|
47.4%
|
52.6%
|
| 11th
|
41.8%
|
58.2%
|
References
Works cited
.jpg)