2010 United States House of Representatives elections in Pennsylvania
| ||||||||||||||||||||||||||||
All 19 Pennsylvania seats to the United States House of Representatives | ||||||||||||||||||||||||||||
|---|---|---|---|---|---|---|---|---|---|---|---|---|---|---|---|---|---|---|---|---|---|---|---|---|---|---|---|---|
| ||||||||||||||||||||||||||||
| ||||||||||||||||||||||||||||
| Elections in Pennsylvania |
|---|
 |
|
|
The 2010 congressional elections in Pennsylvania were held on November 2, 2010. Pennsylvania had nineteen seats in the United States House of Representatives. The election was held on the same day as many other PA elections, and the same day as House of Representatives elections in other states. Party primary elections were held May 18, 2010.
Overview
| United States House of Representatives elections in Pennsylvania, 2010[1] | ||||||
|---|---|---|---|---|---|---|
| Party | Votes | Percentage | Seats Before | Seats After | +/– | |
| Republican | 2,034,145 | 51.41% | 7 | 12 | +5 | |
| Democratic | 1,882,202 | 47.57% | 12 | 7 | -5 | |
| Independent | 40,054 | 1.01% | 0 | 0 | 0 | |
| Totals | 3,956,401 | 100.00% | 19 | 19 | — | |
By district
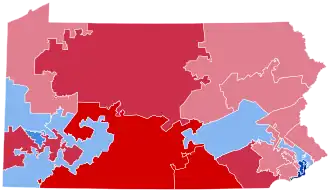
Results of the 2010 United States House of Representatives elections in Pennsylvania by district:[2]
| District | Republican | Democratic | Others | Total | Result | ||||
|---|---|---|---|---|---|---|---|---|---|
| Votes | % | Votes | % | Votes | % | Votes | % | ||
| District 1 | 0 | 0.00% | 149,944 | 100.00% | 0 | 0.00% | 149,944 | 100.00% | Democratic hold |
| District 2 | 21,907 | 10.70% | 182,800 | 89.30% | 0 | 0.00% | 204,707 | 100.00% | Democratic hold |
| District 3 | 111,909 | 55.72% | 88,924 | 44.28% | 0 | 0.00% | 200,833 | 100.00% | Republican gain |
| District 4 | 116,958 | 49.19% | 120,827 | 50.81% | 0 | 0.00% | 237,785 | 100.00% | Democratic hold |
| District 5 | 127,427 | 68.69% | 52,375 | 28.23% | 5,710 | 3.08% | 185,512 | 100.00% | Republican hold |
| District 6 | 133,770 | 57.10% | 100,493 | 42.90% | 0 | 0.00% | 234,263 | 100.00% | Republican hold |
| District 7 | 137,825 | 54.94% | 110,314 | 43.98% | 2,708 | 1.08% | 250,847 | 100.00% | Republican gain |
| District 8 | 130,759 | 53.52% | 113,547 | 46.48% | 0 | 0.00% | 244,306 | 100.00% | Republican gain |
| District 9 | 141,904 | 73.06% | 52,322 | 26.94% | 0 | 0.00% | 194,226 | 100.00% | Republican hold |
| District 10 | 110,599 | 55.18% | 89,846 | 44.82% | 0 | 0.00% | 200,445 | 100.00% | Republican gain |
| District 11 | 102,179 | 54.70% | 84,618 | 45.30% | 0 | 0.00% | 186,797 | 100.00% | Republican gain |
| District 12 | 91,170 | 49.22% | 94,056 | 50.78% | 0 | 0.00% | 185,226 | 100.00% | Democratic hold |
| District 13 | 91,987 | 43.66% | 118,710 | 56.34% | 0 | 0.00% | 210,697 | 100.00% | Democratic hold |
| District 14 | 49,997 | 28.17% | 122,073 | 68.79% | 5,400 | 3.04% | 177,470 | 100.00% | Democratic hold |
| District 15 | 109,534 | 53.55% | 79,766 | 39.00% | 15,248 | 7.45% | 204,548 | 100.00% | Republican hold |
| District 16 | 134,113 | 65.39% | 70,994 | 34.61% | 0 | 0.00% | 205,107 | 100.00% | Republican hold |
| District 17 | 95,000 | 44.50% | 118,486 | 55.50% | 0 | 0.00% | 213,486 | 100.00% | Democratic hold |
| District 18 | 161,888 | 67.33% | 78,558 | 32.67% | 0 | 0.00% | 240,446 | 100.00% | Republican hold |
| District 19 | 165,219 | 71.91% | 53,549 | 23.31% | 10,988 | 4.78% | 229,756 | 100.00% | Republican hold |
| Total | 2,034,145 | 51.41% | 1,882,202 | 47.57% | 40,054 | 1.01% | 3,956,401 | 100.00% | |
District 1
| |||||||||||||||||
| |||||||||||||||||
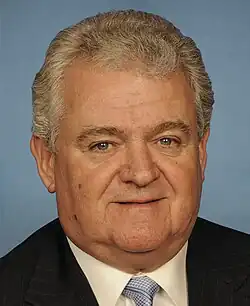
Democratic incumbent Bob Brady was the only member of the Pennsylvania delegation who ran unopposed in 2010.
Brady, a long time central figure in the Pennsylvania Democratic Party, has never received less than 74% in a general election, and opponents have had difficult recruiting even moderately electable candidates in this majority-minority district that includes South Philadelphia and some working class suburbs in Delaware County. No Republican has represented this district since 1949. In 2008, he earned 91% of the vote against Mike Muhammad, a teacher who raised no outside funds. Respected for his ability to reach political deals behind the scenes, Brady has garnered an image as an effective politician, and thus has been rarely challenged by other Democrats. In 2010, Pia Varma, a young freelance writer for conservative publications attempted to gain the Republican nomination, but failed to produce enough signatures to appear on the ballot.
- PA - District 1 from OurCampaigns.com
- Race ranking and details from CQ Politics
- Campaign contributions from OpenSecrets
Democratic primary
Candidates
Nominee
- Bob Brady, incumbent U.S. Representative
Primary results
| Party | Candidate | Votes | % | |
|---|---|---|---|---|
| Democratic | Bob Brady (incumbent) | 48,505 | 100.00 | |
| Total votes | 48,505 | 100.00 | ||
Predictions
| Source | Ranking | As of |
|---|---|---|
| The Cook Political Report[4] | Safe D | November 1, 2010 |
| Rothenberg[5] | Safe D | November 1, 2010 |
| Sabato's Crystal Ball[6] | Safe D | November 1, 2010 |
| RCP[7] | Safe D | November 1, 2010 |
| CQ Politics[8] | Safe D | October 28, 2010 |
| New York Times[9] | Safe D | November 1, 2010 |
| FiveThirtyEight[9] | Safe D | November 1, 2010 |
General election
| Party | Candidate | Votes | % | |
|---|---|---|---|---|
| Democratic | Bob Brady (incumbent) | 149,944 | 100.00 | |
| Total votes | 149,944 | 100.00 | ||
District 2
| |||||||||||||||||
| |||||||||||||||||
.jpg)

Democratic incumbent Chaka Fattah ran for reelection. He faced Republican Rick Hellberg, the CEO of a small financial firm. In 2008, Obama carried this district with 90% of the vote.
Fattah represents one of the top five most Democratic districts in the country, and has never received less than 79% of the vote in his over fifteen-year House career. The district includes North Philadelphia and several traditionally liberal suburbs in Montgomery County. Fattah has had the consistent support of the African American community that is the base of a district that hasn't swung Republican since the 1946 elections. Despite this huge Democratic advantage, the district has small pockets of solid Republican territory, and thus Fattah has continuously received GOP opponents (although ones who were unable to raise all more than a few thousand dollars in fundraising), unlike his counterpart in the 1st District. In 2008, Fattah defeated engineer Adam Lang with 81% of the vote.
Fattah won the 2010 general election with 89.3% of the vote.[10]
- PA - District 2 from OurCampaigns.com
- Race ranking and details from CQ Politics
- Campaign contributions from OpenSecrets
Democratic primary
Candidates
Nominee
- Chaka Fattah, incumbent U.S. Representative
Primary results
| Party | Candidate | Votes | % | |
|---|---|---|---|---|
| Democratic | Chaka Fattah (incumbent) | 72,417 | 100.00 | |
| Total votes | 72,417 | 100.00 | ||
Republican primary
Candidates
Nominee
- Rick Hellberg, financial firm CEO
Primary results
| Party | Candidate | Votes | % | |
|---|---|---|---|---|
| Republican | Rick Hellberg | 3,781 | 100.00 | |
| Total votes | 3,781 | 100.00 | ||
Predictions
| Source | Ranking | As of |
|---|---|---|
| The Cook Political Report[4] | Safe D | November 1, 2010 |
| Rothenberg[5] | Safe D | November 1, 2010 |
| Sabato's Crystal Ball[6] | Safe D | November 1, 2010 |
| RCP[7] | Safe D | November 1, 2010 |
| CQ Politics[8] | Safe D | October 28, 2010 |
| New York Times[9] | Safe D | November 1, 2010 |
| FiveThirtyEight[9] | Safe D | November 1, 2010 |
General election
| Party | Candidate | Votes | % | |
|---|---|---|---|---|
| Democratic | Chaka Fattah (incumbent) | 182,800 | 89.30 | |
| Republican | Rick Hellberg | 21,907 | 10.70 | |
| Total votes | 204,707 | 100.00 | ||
District 3
| |||||||||||||||||
| |||||||||||||||||
.jpg)
.jpg)
Democratic incumbent Kathy Dahlkemper unsuccessfully ran for re-election, losing to Republican businessman Mike Kelly, who received 55.7% of the vote.[10] In 2008, McCain carried this district with 49% of the vote.
Dahlkemper faced a difficult reelection bid, in a race that considered a tossup by most political analysts. Dahlkemper became used to tight campaigns in her short political career. A political unknown prior to her 2008 campaign, Dahlkemper leveraged a moderate, blue collar image that enticed Democratic voters in a district that is pro-union, with a center-right tilt on social issues. Dahlkemper, the owner of a large landscaping business and manager of an Erie County arboretum, came from behind to defeat Erie County Concilman Kyle Foust, the endorsed Democratic candidate. She then went on to narrowly unseat (with 52% of the vote) Congressman Phil English, a moderate Republican who had maintained good relations with labor, by attacking his ties to the Bush administration and for failing to follow through on a promise to retire after six terms. During her first term, Dahlkemper has served as a member of the Blue Dog Coalition of conservative Democrats, which has allowed her to keep a middle ground image. However, her vote in favor of healthcare legislation and the lack of an entrenched image in certain corners of the district left her vulnerable.
In 2010, Dahlkemper faced a primary challenge from former foreign affairs official Mel Marin, winning with 73% of the vote. Republicans focused heavily on regaining the seat, and six GOP candidates earned spots on the ballot: automobile dealer Mike Kelly, manufacturing executive Paul Huber, pharmaceutical representative Clayton Grabb, physician Steve Fisher, factory foreman Ed Franz, and accountant Martha Moore. Kelly and Huber far outraised the remaining four challengers, and they became entangled in an expensive campaign. Kelly was eventually victorious, winning 28% of the vote to Huber's 27% in the factious affair.
Kelly, a former member of the Butler City Council, had a base of support in the heavily Republican Butler County, while Dahlkemper was well known in Erie, the center of population for the district. Other small cities in the district, such as Sharon and Meadville were swing regions, with a slightly conservative tilt that balanced out strongly Democratic Erie. John McCain carried the 3rd District by a 49%-48% margin, which reflects the political balance of the area.
- PA - District 3 from OurCampaigns.com
- Race ranking and details from CQ Politics
- Campaign contributions from OpenSecrets
Democratic primary
Candidates
Nominee
- Kathy Dahlkemper, incumbent U.S. Representative
Eliminated in primary
- Mel Marin, foreign affairs official
Primary results
| Party | Candidate | Votes | % | |
|---|---|---|---|---|
| Democratic | Kathy Dahlkemper (incumbent) | 34,932 | 73.24 | |
| Democratic | Mel Marin | 12,764 | 26.76 | |
| Total votes | 47,696 | 100.00 | ||
Republican primary
Candidates
Nominee
- Mike Kelly, automobile dealer
Eliminated in primary
- Steven Fisher, physician
- Ed Franz, factory foreman
- Clayton Grabb, pharmaceutical representative
- Paul Huber, manufacturing executive
- Martha Moore, accountant
Primary results
| Party | Candidate | Votes | % | |
|---|---|---|---|---|
| Republican | Mike Kelly | 15,428 | 28.11 | |
| Republican | Paul Huber | 14,474 | 26.38 | |
| Republican | Clayton Grabb | 7,486 | 13.64 | |
| Republican | Steven Fisher | 6,499 | 11.84 | |
| Republican | Ed Franz | 5,838 | 10.64 | |
| Republican | Martha Moore | 5,151 | 9.39 | |
| Total votes | 54,876 | 100.00 | ||
Polling
| Poll source | Date(s) administered |
Sample size |
Margin of error |
Kathy Dahlkemper (D) | Mike Kelly (R) | Undecided |
|---|---|---|---|---|---|---|
| The Hill/ANG Alliance[11] | September 25–27, 2010 | 401 | ± 4.9% | 36% | 49% | 15% |
| Franklin-Marshall[12] | September 14–19, 2010 | 482 | ± 4.5% | 38% | 44% | 18% |
| The Polling Company[13] | July 29-August 1, 2010 | 314 | ± 5.5% | 46% | 42% | 11% |
Predictions
| Source | Ranking | As of |
|---|---|---|
| The Cook Political Report[4] | Lean R (flip) | November 1, 2010 |
| Rothenberg[5] | Likely R (flip) | November 1, 2010 |
| Sabato's Crystal Ball[6] | Lean R (flip) | November 1, 2010 |
| RCP[7] | Lean R (flip) | November 1, 2010 |
| CQ Politics[8] | Likely R (flip) | October 28, 2010 |
| New York Times[9] | Lean R (flip) | November 1, 2010 |
| FiveThirtyEight[9] | Likely R (flip) | November 1, 2010 |
General election
| Party | Candidate | Votes | % | |
|---|---|---|---|---|
| Republican | Mike Kelly | 111,909 | 55.72 | |
| Democratic | Kathy Dahlkemper (incumbent) | 88,924 | 44.28 | |
| Total votes | 200,833 | 100.00 | ||
District 4
| |||||||||||||||||
| |||||||||||||||||
.jpg)
.jpg)
Democratic incumbent Jason Altmire ran for re-election and faced Republican attorney Keith Rothfus. In 2008, McCain carried this district with 55% of the vote.
Altmire narrowly won re-election with 50.8% of the vote.[10]
- PA - District 4 from OurCampaigns.com
- Race ranking and details from CQ Politics
- Campaign contributions from OpenSecrets
Democratic primary
Candidates
Nominee
- Jason Altmire, incumbent U.S. Representative
Primary results
| Party | Candidate | Votes | % | |
|---|---|---|---|---|
| Democratic | Jason Altmire (incumbent) | 53,019 | 100.00 | |
| Total votes | 53,019 | 100.00 | ||
Republican primary
Candidates
Nominee
- Keith Rothfus, attorney
Eliminated in primary
- Mary Beth Buchanan, former United States Attorney for the Western District of Pennsylvania
Primary results
| Party | Candidate | Votes | % | |
|---|---|---|---|---|
| Republican | Keith Rothfus | 34,996 | 66.41 | |
| Republican | Mary Beth Buchanan | 17,701 | 33.59 | |
| Total votes | 52,697 | 100.00 | ||
Predictions
| Source | Ranking | As of |
|---|---|---|
| The Cook Political Report[4] | Lean D | November 1, 2010 |
| Rothenberg[5] | Likely D | November 1, 2010 |
| Sabato's Crystal Ball[6] | Likely D | November 1, 2010 |
| RCP[7] | Lean D | November 1, 2010 |
| CQ Politics[8] | Likely D | October 28, 2010 |
| New York Times[9] | Lean D | November 1, 2010 |
| FiveThirtyEight[9] | Likely D | November 1, 2010 |
General election
| Party | Candidate | Votes | % | |
|---|---|---|---|---|
| Democratic | Jason Altmire (incumbent) | 120,827 | 50.81 | |
| Republican | Keith Rothfus | 116,958 | 49.19 | |
| Total votes | 237,785 | 100.00 | ||
District 5
| |||||||||||||||||
| |||||||||||||||||
.jpg)
Republican incumbent Glenn "G.T." Thompson successfully ran for re-election. He defeated Democrat Michael Pipe and Libertarian Vernon Etzel. In 2008, McCain carried this district with 55% of the vote.
- PA - District 5 from OurCampaigns.com
- Race ranking and details from CQ Politics
- Campaign contributions from OpenSecrets
Democratic primary
Candidates
Nominee
- Michael Pipe
Primary results
| Party | Candidate | Votes | % | |
|---|---|---|---|---|
| Democratic | Michael Pipe | 31,120 | 100.00 | |
| Total votes | 31,120 | 100.00 | ||
Republican primary
Candidates
Nominee
- Glenn Thompson, incumbent U.S. Representative
Primary results
| Party | Candidate | Votes | % | |
|---|---|---|---|---|
| Republican | Glenn Thompson (incumbent) | 52,856 | 100.00 | |
| Total votes | 52,856 | 100.00 | ||
Predictions
| Source | Ranking | As of |
|---|---|---|
| The Cook Political Report[4] | Safe R | November 1, 2010 |
| Rothenberg[5] | Safe R | November 1, 2010 |
| Sabato's Crystal Ball[6] | Safe R | November 1, 2010 |
| RCP[7] | Safe R | November 1, 2010 |
| CQ Politics[8] | Safe R | October 28, 2010 |
| New York Times[9] | Safe R | November 1, 2010 |
| FiveThirtyEight[9] | Safe R | November 1, 2010 |
General election
| Party | Candidate | Votes | % | |
|---|---|---|---|---|
| Republican | Glenn Thompson (incumbent) | 127,427 | 68.69 | |
| Democratic | Michael Pipe | 52,375 | 28.23 | |
| Libertarian | Vernon Etzel | 5,710 | 3.08 | |
| Total votes | 185,512 | 100.00 | ||
District 6
| |||||||||||||||||
| |||||||||||||||||

Republican incumbent Jim Gerlach successfully ran for re-election. He defeated Democrat Iraq War veteran Manan Trivedi. In 2008, Obama carried this district with 58% of the vote.
- PA - District 6 from OurCampaigns.com
- Race ranking and details from CQ Politics
- Campaign contributions from OpenSecrets
Democratic primary
Nominee
- Manan Trivedi, physician and Iraq War veteran
Eliminated in primary
- Doug Pike
Primary results
| Party | Candidate | Votes | % | |
|---|---|---|---|---|
| Democratic | Manan Trivedi | 21,585 | 50.84 | |
| Democratic | Doug Pike | 20,871 | 49.16 | |
| Total votes | 42,456 | 100.0 | ||
Republican primary
Nominee
- Jim Gerlach, incumbent U.S. Representative
Eliminated in primary
- Patrick Henry Sellers
Primary results
| Party | Candidate | Votes | % | |
|---|---|---|---|---|
| Republican | Jim Gerlach (incumbent) | 35,575 | 79.81 | |
| Republican | Patrick Henry Sellers | 8,998 | 20.19 | |
| Total votes | 44,573 | 100.00 | ||
Predictions
| Source | Ranking | As of |
|---|---|---|
| The Cook Political Report[4] | Likely R | November 1, 2010 |
| Rothenberg[5] | Safe R | November 1, 2010 |
| Sabato's Crystal Ball[6] | Likely R | November 1, 2010 |
| RCP[7] | Safe R | November 1, 2010 |
| CQ Politics[8] | Lean R | October 28, 2010 |
| New York Times[9] | Safe R | November 1, 2010 |
| FiveThirtyEight[9] | Lean R | November 1, 2010 |
General election
| Party | Candidate | Votes | % | |
|---|---|---|---|---|
| Republican | Jim Gerlach (incumbent) | 133,770 | 57.10 | |
| Democratic | Manan Trivedi | 100,493 | 42.90 | |
| Total votes | 234,263 | 100.00 | ||
District 7
| |||||||||||||||||
| |||||||||||||||||
.jpg)

Democratic incumbent Joe Sestak retired to run for the U.S. Senate. Democratic nominee State Representative Bryan Lentz faced Republican nominee U.S. Attorney Pat Meehan and American Constitution Party (independent) nominee Jim Schneller.
- PA - District 7 from OurCampaigns.com
- Race ranking and details from CQ Politics
- Campaign contributions from OpenSecrets
Democratic primary
Nominee
- Bryan Lentz, State Representative
Primary results
| Party | Candidate | Votes | % | |
|---|---|---|---|---|
| Democratic | Bryan Lentz | 39,206 | 100.00 | |
| Total votes | 39,206 | 100.00 | ||
Republican primary
Nominee
- Pat Meehan, former United States Attorney for the Eastern District of Pennsylvania
Primary results
| Party | Candidate | Votes | % | |
|---|---|---|---|---|
| Republican | Pat Meehan | 48,604 | 100.00 | |
| Total votes | 48,604 | 100.00 | ||
Predictions
| Source | Ranking | As of |
|---|---|---|
| The Cook Political Report[4] | Lean R (flip) | November 1, 2010 |
| Rothenberg[5] | Tilt R (flip) | November 1, 2010 |
| Sabato's Crystal Ball[6] | Lean R (flip) | November 1, 2010 |
| RCP[7] | Tossup | November 1, 2010 |
| CQ Politics[8] | Tossup | October 28, 2010 |
| New York Times[9] | Lean R (flip) | November 1, 2010 |
| FiveThirtyEight[9] | Lean R (flip) | November 1, 2010 |
General election
| Party | Candidate | Votes | % | |
|---|---|---|---|---|
| Republican | Pat Meehan | 134,751 | 54.86 | |
| Democratic | Bryan Lentz | 108,197 | 44.05 | |
| Independent | Jim Schneller | 2,670 | 1.09 | |
| Total votes | 245,618 | 100.00 | ||
District 8
| |||||||||||||||||
| |||||||||||||||||
.jpg)

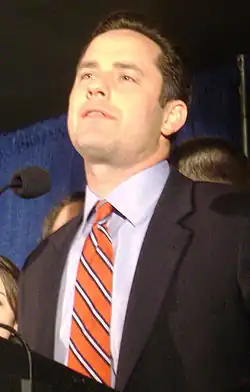
Democratic incumbent Patrick Murphy unsuccessfully ran for re-election. He was defeated by Republican former U.S. Congressman Mike Fitzpatrick. In 2008, Obama carried this district with 54% of the vote.
- PA - District 8 from OurCampaigns.com
- Race ranking and details from CQ Politics
- Campaign contributions from OpenSecrets
Democratic primary
Nominee
- Patrick Murphy, incumbent U.S. Representative
Primary results
| Party | Candidate | Votes | % | |
|---|---|---|---|---|
| Democratic | Patrick Murphy (incumbent) | 40,783 | 100.00 | |
| Total votes | 40,783 | 100.00 | ||
Republican primary
Nominee
- Mike Fitzpatrick, former U.S. Representative (2005 – 2007)
Eliminated in primary
- Gloria Carlineo
- Ira Hoffman
- James Jones
Primary results
| Party | Candidate | Votes | % | |
|---|---|---|---|---|
| Republican | Mike Fitzpatrick | 33,671 | 76.75 | |
| Republican | Gloria Carlineo | 6,529 | 14.88 | |
| Republican | Ira Hoffman | 2,424 | 5.52 | |
| Republican | James Jones | 1,249 | 2.85 | |
| Total votes | 43,873 | 100.00 | ||
Polling
| Poll source | Date(s) administered |
Sample size |
Margin of error |
Patrick Murphy (D) | Mike Fitzpatrick (R) | Undecided |
|---|---|---|---|---|---|---|
| Franklin-Marshall[14] | September 14–19, 2010 | 464 | ± 4.6% | 35% | 49% | 15% |
| Franklin-Marshall[14] | October 14–19, 2010 | 464 | ± 4.6% | 40% | 47% | 5% |
| Franklin-Marshall[14] | October 24–29, 2010 | 464 | ± 4.6% | 35% | 55% | 5% |
Predictions
| Source | Ranking | As of |
|---|---|---|
| The Cook Political Report[4] | Tossup | November 1, 2010 |
| Rothenberg[5] | Tilt R (flip) | November 1, 2010 |
| Sabato's Crystal Ball[6] | Lean R (flip) | November 1, 2010 |
| RCP[7] | Tossup | November 1, 2010 |
| CQ Politics[8] | Tossup | October 28, 2010 |
| New York Times[9] | Tossup | November 1, 2010 |
| FiveThirtyEight[9] | Lean R (flip) | November 1, 2010 |
General election
| Party | Candidate | Votes | % | |
|---|---|---|---|---|
| Republican | Mike Fitzpatrick | 130,759 | 53.52 | |
| Democratic | Patrick Murphy (incumbent) | 113,547 | 46.48 | |
| Total votes | 244,306 | 100.00 | ||
District 9
| |||||||||||||||||
| |||||||||||||||||
.jpg)
Republican incumbent Bill Shuster successfully ran for re-election. He defeated Democrat Tom Conners and Independent Chad Clopper.
- PA - District 9 from OurCampaigns.com
- Race ranking and details from CQ Politics
- Campaign contributions from OpenSecrets
Republican primary
Nominee
- Bill Shuster, incumbent U.S. Representative
Primary results
| Party | Candidate | Votes | % | |
|---|---|---|---|---|
| Republican | Bill Shuster (incumbent) | 56,828 | 100.00 | |
| Total votes | 56,828 | 100.00 | ||
Predictions
| Source | Ranking | As of |
|---|---|---|
| The Cook Political Report[4] | Safe R | November 1, 2010 |
| Rothenberg[5] | Safe R | November 1, 2010 |
| Sabato's Crystal Ball[6] | Safe R | November 1, 2010 |
| RCP[7] | Safe R | November 1, 2010 |
| CQ Politics[8] | Safe R | October 28, 2010 |
| New York Times[9] | Safe R | November 1, 2010 |
| FiveThirtyEight[9] | Safe R | November 1, 2010 |
General election
| Party | Candidate | Votes | % | |
|---|---|---|---|---|
| Republican | Bill Shuster | 141,904 | 73.06 | |
| Democratic | Tom Conners | 52,322 | 26.94 | |
| Total votes | 194,226 | 100.00 | ||
District 10
| |||||||||||||||||
| |||||||||||||||||
.jpg)
.jpg)
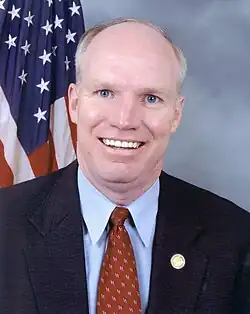
Democratic incumbent Chris Carney unsuccessfully ran for re-election, losing to Republican nominee U.S. Attorney Tom Marino. In 2008, McCain carried this district with 54% of the vote.
- PA - District 10 from OurCampaigns.com
- Race ranking and details from CQ Politics
- Campaign contributions from OpenSecrets
Democratic primary
Nominee
- Chris Carney, incumbent U.S. Representative
Primary results
| Party | Candidate | Votes | % | |
|---|---|---|---|---|
| Democratic | Chris Carney (incumbent) | 38,928 | 100.00 | |
| Total votes | 38,928 | 100.00 | ||
Republican primary
Nominee
- Tom Marino, former United States Attorney for the Middle District of Pennsylvania
Eliminated in primary
- Malcolm Derk
- David Madeira
Primary results
| Party | Candidate | Votes | % | |
|---|---|---|---|---|
| Republican | Tom Marino | 24,435 | 40.96 | |
| Republican | David Madeira | 18,524 | 31.06 | |
| Republican | Malcolm Derk | 16,690 | 27.98 | |
| Total votes | 59,649 | 100.00 | ||
Predictions
| Source | Ranking | As of |
|---|---|---|
| The Cook Political Report[4] | Tossup | November 1, 2010 |
| Rothenberg[5] | Tossup | November 1, 2010 |
| Sabato's Crystal Ball[6] | Lean R (flip) | November 1, 2010 |
| RCP[7] | Lean R (flip) | November 1, 2010 |
| CQ Politics[8] | Tossup | October 28, 2010 |
| New York Times[9] | Tossup | November 1, 2010 |
| FiveThirtyEight[9] | Likely R (flip) | November 1, 2010 |
General election
| Party | Candidate | Votes | % | |
|---|---|---|---|---|
| Republican | Tom Marino | 110,599 | 55.18 | |
| Democratic | Chris Carney (incumbent) | 89,846 | 44.82 | |
| Total votes | 200,445 | 100.00 | ||
District 11
| |||||||||||||||||
| |||||||||||||||||
.jpg)
Democratic incumbent Paul E. Kanjorski unsuccessfully ran for re-election, losing to Republican Hazleton Mayor Lou Barletta.[15] In 2008, Obama carried this district with 57% of the vote.
Kanjorski faced Corey O'Brien and Brian Kelly in the May 2010 Democratic primary, and won with 49.3% of the primary vote.
- PA - District 11 from OurCampaigns.com
- Race ranking and details from CQ Politics
- Campaign contributions from OpenSecrets
Democratic primary
Nominee
- Paul Kanjorski, incumbent U.S. Representative
Eliminated in primary
- Brian Kelly
- Corey O'Brien, member of the Lackawanna County Board of Commissioners
Primary results
| Party | Candidate | Votes | % | |
|---|---|---|---|---|
| Democratic | Paul Kanjorski (incumbent) | 33,900 | 49.36 | |
| Democratic | Corey O'Brien | 23,267 | 33.87 | |
| Democratic | Brian Kelly | 11,519 | 16.77 | |
| Total votes | 68,686 | 100.00 | ||
Republican primary
Nominee
- Lou Barletta, mayor of Hazleton
Primary results
| Party | Candidate | Votes | % | |
|---|---|---|---|---|
| Republican | Lou Barletta | 28,397 | 100.00 | |
| Total votes | 28,397 | 100.00 | ||
Predictions
| Source | Ranking | As of |
|---|---|---|
| The Cook Political Report[4] | Tossup | November 1, 2010 |
| Rothenberg[5] | Tilt R (flip) | November 1, 2010 |
| Sabato's Crystal Ball[6] | Lean R (flip) | November 1, 2010 |
| RCP[7] | Tossup | November 1, 2010 |
| CQ Politics[8] | Lean R (flip) | October 28, 2010 |
| New York Times[9] | Lean R (flip) | November 1, 2010 |
| FiveThirtyEight[9] | Tossup | November 1, 2010 |
General election
| Party | Candidate | Votes | % | |
|---|---|---|---|---|
| Republican | Lou Barletta | 102,179 | 54.70 | |
| Democratic | Paul Kanjorski (incumbent) | 84,618 | 45.30 | |
| Total votes | 186,797 | 100.00 | ||
District 12
| |||||||||||||||||
| |||||||||||||||||

Democrat Mark Critz won a May 2010 special election to replace John Murtha, who served the district for 36 years. He faced Republican businessman Tim Burns. Critz again defeated Burns in the regularly scheduled November general election. In 2008, McCain carried this district with 49% of the vote.
- PA - District 12 from OurCampaigns.com
- Race ranking and details from CQ Politics
- Campaign contributions from OpenSecrets
- Pennsylvania 12th District Candidates debate on C-SPAN, May 5, 2010 (1:00:00)
Special election
| Party | Candidate | Votes | % | |
|---|---|---|---|---|
| Democratic | Mark Critz | 72,218 | 52.64 | |
| Republican | Tim Burns | 61,722 | 44.99 | |
| Libertarian | Demo Agoris | 3,249 | 2.37 | |
| Total votes | 137,189 | 100.00 | ||
Democratic primary
Nominee
- Mark Critz, incumbent U.S. Representative
Eliminated in primary
- Ryan Bucchianeri, United States Navy veteran
- Ronald Mackell, United States Air Force veteran
Primary results
| Party | Candidate | Votes | % | |
|---|---|---|---|---|
| Democratic | Mark Critz (incumbent) | 58,817 | 71.46 | |
| Democratic | Ryan Bucchianeri | 16,965 | 20.61 | |
| Democratic | Ronald Mackell | 6,525 | 7.93 | |
| Total votes | 82,307 | 100.00 | ||
Republican primary
Nominee
- Tim Burns, businessman and Republican nominee in the special election
Eliminated in primary
- William Russell, 2008 Republican nominee
Primary results
| Party | Candidate | Votes | % | |
|---|---|---|---|---|
| Republican | Tim Burns | 26,577 | 56.96 | |
| Republican | William Russell | 20,078 | 43.04 | |
| Total votes | 46,655 | 100.00 | ||
Predictions
| Source | Ranking | As of |
|---|---|---|
| The Cook Political Report[4] | Lean D | November 1, 2010 |
| Rothenberg[5] | Tossup | November 1, 2010 |
| Sabato's Crystal Ball[6] | Lean D | November 1, 2010 |
| RCP[7] | Tossup | November 1, 2010 |
| CQ Politics[8] | Lean D | October 28, 2010 |
| New York Times[9] | Lean D | November 1, 2010 |
| FiveThirtyEight[9] | Lean D | November 1, 2010 |
General election
| Party | Candidate | Votes | % | |
|---|---|---|---|---|
| Democratic | Mark Critz (incumbent) | 94,056 | 50.78 | |
| Republican | Tim Burns | 91,170 | 49.22 | |
| Total votes | 185,226 | 100.00 | ||
District 13
| |||||||||||||||||
| |||||||||||||||||

Democratic incumbent Allyson Schwartz successfully ran for re-election. She defeated Republican Dee Adcock. Obama carried this district with 59% of the vote.
- PA - District 13 from OurCampaigns.com
- Race ranking and details from CQ Politics
- Campaign contributions from OpenSecrets
Democratic primary
Nominee
- Allyson Schwartz, incumbent U.S. Representative
Primary results
| Party | Candidate | Votes | % | |
|---|---|---|---|---|
| Democratic | Allyson Schwartz (incumbent) | 44,402 | 100.00 | |
| Total votes | 44,402 | 100.00 | ||
Republican primary
Nominee
- Dee Adcock
Eliminated in primary
- Brian Haughton
- Joshua Quinter
Primary results
| Party | Candidate | Votes | % | |
|---|---|---|---|---|
| Republican | Dee Adcock | 14,416 | 47.98 | |
| Republican | Joshua Quinter | 8,334 | 27.74 | |
| Republican | Brian Haughton | 7,293 | 24.28 | |
| Total votes | 30,043 | 100.00 | ||
Predictions
| Source | Ranking | As of |
|---|---|---|
| The Cook Political Report[4] | Safe D | November 1, 2010 |
| Rothenberg[5] | Safe D | November 1, 2010 |
| Sabato's Crystal Ball[6] | Safe D | November 1, 2010 |
| RCP[7] | Likely D | November 1, 2010 |
| CQ Politics[8] | Safe D | October 28, 2010 |
| New York Times[9] | Safe D | November 1, 2010 |
| FiveThirtyEight[9] | Safe D | November 1, 2010 |
General election
| Party | Candidate | Votes | % | |
|---|---|---|---|---|
| Democratic | Allyson Schwartz (incumbent) | 118,710 | 56.34 | |
| Republican | Dee Adcock | 91,987 | 43.66 | |
| Total votes | 210,697 | 100.00 | ||
District 14
| |||||||||||||||||
| |||||||||||||||||
.jpg)
Democratic incumbent Mike Doyle successfully ran for re-election. He defeated Republican Melissa Haluszczak and Green Party nominee Ed Bortz. In 2008, Doyle received 91% of the vote and Obama carried this district with 70% of the vote.
- PA - District 14 from OurCampaigns.com
- Race ranking and details from CQ Politics
- Campaign contributions from OpenSecrets
Democratic primary
Nominee
- Mike Doyle, incumbent U.S. Representative
Primary results
| Party | Candidate | Votes | % | |
|---|---|---|---|---|
| Democratic | Mike Doyle (incumbent) | 71,511 | 100.00 | |
| Total votes | 71,511 | 100.00 | ||
Republican primary
Nominee
- Melissa Haluszczak
Primary results
| Party | Candidate | Votes | % | |
|---|---|---|---|---|
| Republican | Melissa Haluszczak | 11,585 | 100.00 | |
| Total votes | 11,585 | 100.00 | ||
Predictions
| Source | Ranking | As of |
|---|---|---|
| The Cook Political Report[4] | Safe D | November 1, 2010 |
| Rothenberg[5] | Safe D | November 1, 2010 |
| Sabato's Crystal Ball[6] | Safe D | November 1, 2010 |
| RCP[7] | Safe D | November 1, 2010 |
| CQ Politics[8] | Safe D | October 28, 2010 |
| New York Times[9] | Safe D | November 1, 2010 |
| FiveThirtyEight[9] | Safe D | November 1, 2010 |
General election
| Party | Candidate | Votes | % | |
|---|---|---|---|---|
| Democratic | Mike Doyle (incumbent) | 122,073 | 68.79 | |
| Republican | Melissa Haluszczak | 49,997 | 28.17 | |
| Green | Ed Bortz | 5,400 | 3.04 | |
| Total votes | 177,470 | 100.00 | ||
District 15
| |||||||||||||||||||||
| |||||||||||||||||||||
.jpg)
Republican incumbent Charlie Dent successfully ran for re-election. He defeated Democrat Bethlehem Mayor John B. Callahan and Independent Jake Towne. In 2008, Obama carried this district with 56% of the vote.
- PA - District 15 from OurCampaigns.com
- Race ranking and details from CQ Politics
- Campaign contributions from OpenSecrets
Democratic primary
Nominee
- John B. Callahan, mayor of Bethlehem
Primary results
| Party | Candidate | Votes | % | |
|---|---|---|---|---|
| Democratic | John B. Callahan | 32,825 | 100.00 | |
| Total votes | 32,825 | 100.00 | ||
Republican primary
Nominee
- Charlie Dent, incumbent U.S. Representative
Eliminated in primary
- Mat Benol
Primary results
| Party | Candidate | Votes | % | |
|---|---|---|---|---|
| Republican | Charlie Dent (incumbent) | 31,618 | 82.92 | |
| Republican | Mat Benol | 6,514 | 17.08 | |
| Total votes | 38,132 | 100.00 | ||
Polling
| Poll source | Date(s) administered |
Sample size |
Margin of error |
John Callahan (D) | Charlie Dent (R) | Jake Towne (I) | Undecided |
|---|---|---|---|---|---|---|---|
| Morning Call/Muhlenberg[16] | September 11–15, 2010 | 496 | ± 5.0% | 38% | 49% | 3% | 10% |
Predictions
| Source | Ranking | As of |
|---|---|---|
| The Cook Political Report[4] | Likely R | November 1, 2010 |
| Rothenberg[5] | Likely R | November 1, 2010 |
| Sabato's Crystal Ball[6] | Lean R | November 1, 2010 |
| RCP[7] | Likely R | November 1, 2010 |
| CQ Politics[8] | Lean R | October 28, 2010 |
| New York Times[9] | Lean R | November 1, 2010 |
| FiveThirtyEight[9] | Safe R | November 1, 2010 |
General election
| Party | Candidate | Votes | % | |
|---|---|---|---|---|
| Republican | Charlie Dent (incumbent) | 109,534 | 53.55 | |
| Democratic | John B. Callahan | 79,766 | 39.00 | |
| Independent | Jake Towne | 15,248 | 7.45 | |
| Total votes | 204,548 | 100.00 | ||
District 16
| |||||||||||||||||
| |||||||||||||||||
.jpg)
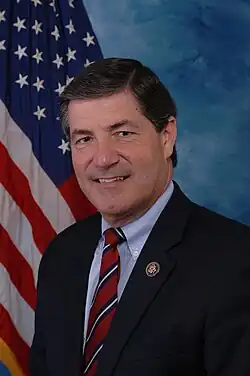
Republican incumbent Joe Pitts successfully ran for re-election. He again defeated Democratic nominee Lois Herr. In 2008, McCain carried the district with 51% of the vote.
- PA - District 16 from OurCampaigns.com
- Race ranking and details from CQ Politics
- Campaign contributions from OpenSecrets
Democratic primary
Nominee
- Lois Herr, political activist
Primary results
| Party | Candidate | Votes | % | |
|---|---|---|---|---|
| Democratic | Lois Herr | 24,541 | 100.00 | |
| Total votes | 24,541 | 100.00 | ||
Republican primary
Nominee
- Joe Pitts, incumbent U.S. Representative
Primary results
| Party | Candidate | Votes | % | |
|---|---|---|---|---|
| Republican | Joe Pitts (incumbent) | 50,629 | 100.00 | |
| Total votes | 50,629 | 100.00 | ||
Predictions
| Source | Ranking | As of |
|---|---|---|
| The Cook Political Report[4] | Safe R | November 1, 2010 |
| Rothenberg[5] | Safe R | November 1, 2010 |
| Sabato's Crystal Ball[6] | Safe R | November 1, 2010 |
| RCP[7] | Safe R | November 1, 2010 |
| CQ Politics[8] | Safe R | October 28, 2010 |
| New York Times[9] | Safe R | November 1, 2010 |
| FiveThirtyEight[9] | Safe R | November 1, 2010 |
General election
| Party | Candidate | Votes | % | |
|---|---|---|---|---|
| Republican | Joe Pitts (incumbent) | 134,113 | 65.39 | |
| Democratic | Lois Herr | 70,994 | 34.61 | |
| Total votes | 205,107 | 100.00 | ||
District 17
| |||||||||||||||||
| |||||||||||||||||

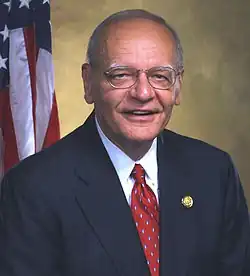
Democratic incumbent Tim Holden successfully ran for re-election. He defeated Republican State Senator Dave Argall. In 2008, McCain carried this district with 51% of the vote.
- PA - District 17 from OurCampaigns.com
- Race ranking and details from CQ Politics
- Campaign contributions from OpenSecrets
Democratic primary
Nominee
- Tim Holden, incumbent U.S. Representative
Eliminated in primary
- Sheila Dow-Ford
Primary results
| Party | Candidate | Votes | % | |
|---|---|---|---|---|
| Democratic | Tim Holden (incumbent) | 30,630 | 65.27 | |
| Democratic | Sheila Dow-Ford | 16,296 | 34.73 | |
| Total votes | 46,926 | 100.00 | ||
Republican primary
Nominee
- Dave Argall, member of the Pennsylvania State Senate
Eliminated in primary
- Josh First
- Allen Griffith
- Frank Ryan
Primary results
| Party | Candidate | Votes | % | |
|---|---|---|---|---|
| Republican | Dave Argall | 20,712 | 32.33 | |
| Republican | Frank Ryan | 19,890 | 31.05 | |
| Republican | Josh First | 14,955 | 23.35 | |
| Republican | Allen Griffith | 8,503 | 13.27 | |
| Total votes | 64,060 | 100.00 | ||
Predictions
| Source | Ranking | As of |
|---|---|---|
| The Cook Political Report[4] | Likely D | November 1, 2010 |
| Rothenberg[5] | Safe D | November 1, 2010 |
| Sabato's Crystal Ball[6] | Likely D | November 1, 2010 |
| RCP[7] | Likely D | November 1, 2010 |
| CQ Politics[8] | Likely D | October 28, 2010 |
| New York Times[9] | Lean D | November 1, 2010 |
| FiveThirtyEight[9] | Safe D | November 1, 2010 |
General election
| Party | Candidate | Votes | % | |
|---|---|---|---|---|
| Democratic | Tim Holden (incumbent) | 118,486 | 55.50 | |
| Republican | Dave Argall | 95,000 | 44.50 | |
| Total votes | 213,486 | 100.00 | ||
District 18
| |||||||||||||||||
| |||||||||||||||||
.jpg)
Republican incumbent Tim Murphy successfully ran for re-election. He defeated Democrat Dan Connolly. In 2008, McCain carried this district with 55% of the vote.
- PA - District 18 from OurCampaigns.com
- Race ranking and details from CQ Politics
- Campaign contributions from OpenSecrets
Democratic primary
Nominee
- Dan Connolly
Primary results
| Party | Candidate | Votes | % | |
|---|---|---|---|---|
| Democratic | Dan Connolly | 58,081 | 100.00 | |
| Total votes | 58,081 | 100.00 | ||
Republican primary
Nominee
- Tim Murphy, incumbent U.S. Representative
Primary results
| Party | Candidate | Votes | % | |
|---|---|---|---|---|
| Republican | Tim Murphy (incumbent) | 47,785 | 100.00 | |
| Total votes | 47,785 | 100.00 | ||
Predictions
| Source | Ranking | As of |
|---|---|---|
| The Cook Political Report[4] | Safe R | November 1, 2010 |
| Rothenberg[5] | Safe R | November 1, 2010 |
| Sabato's Crystal Ball[6] | Safe R | November 1, 2010 |
| RCP[7] | Safe R | November 1, 2010 |
| CQ Politics[8] | Safe R | October 28, 2010 |
| New York Times[9] | Safe R | November 1, 2010 |
| FiveThirtyEight[9] | Safe R | November 1, 2010 |
General election
| Party | Candidate | Votes | % | |
|---|---|---|---|---|
| Republican | Tim Murphy (incumbent) | 161,888 | 67.33 | |
| Democratic | Dan Connolly | 78,558 | 32.67 | |
| Total votes | 240,446 | 100.00 | ||
District 19
| |||||||||||||||||
| |||||||||||||||||
.jpg)
Republican incumbent Todd Platts successfully ran for re-election. He defeated Democrat Ryan Sanders and Independence Party nominee Joshua Monighan.[17][18] In 2008, McCain carried this district with 56% of the vote.
- PA - District 19 from OurCampaigns.com
- Race ranking and details from CQ Politics
- Campaign contributions from OpenSecrets
Democratic primary
Nominee
- Ryan Sanders
Primary results
| Party | Candidate | Votes | % | |
|---|---|---|---|---|
| Democratic | Ryan Sanders | 33,283 | 100.00 | |
| Total votes | 33,283 | 100.00 | ||
Republican primary
Nominee
- Todd Platts, incumbent U.S. Representative
Eliminated in primary
- Michael Smeltzer
Primary results
| Party | Candidate | Votes | % | |
|---|---|---|---|---|
| Republican | Todd Platts (incumbent) | 51,792 | 69.99 | |
| Republican | Michael Smeltzer | 22,210 | 30.01 | |
| Total votes | 74,002 | 100.00 | ||
Predictions
| Source | Ranking | As of |
|---|---|---|
| The Cook Political Report[4] | Safe R | November 1, 2010 |
| Rothenberg[5] | Safe R | November 1, 2010 |
| Sabato's Crystal Ball[6] | Safe R | November 1, 2010 |
| RCP[7] | Safe R | November 1, 2010 |
| CQ Politics[8] | Safe R | October 28, 2010 |
| New York Times[9] | Safe R | November 1, 2010 |
| FiveThirtyEight[9] | Safe R | November 1, 2010 |
General election
| Party | Candidate | Votes | % | |
|---|---|---|---|---|
| Republican | Todd Platts (incumbent) | 165,219 | 71.91 | |
| Democratic | Ryan Sanders | 53,549 | 23.31 | |
| Independence Party of America | Joshua Monighan | 10,988 | 4.78 | |
| Total votes | 229,756 | 100.00 | ||
References
- ^ Office of the Clerk of the U.S. House of Representatives
- ^ Haas, Karen L. (June 3, 2011). "Statistics of the Congressional Election of November 2, 2010". Clerk of the U.S. House of Representatives. Retrieved November 12, 2019.
- ^ a b c d e f g h i j k l m n o p q r s t u v w x y z aa ab ac ad ae af ag ah ai aj "Pennsylvania Elections - 2010 General Primary (Official Returns)". Pennsylvania Department of State. Retrieved August 10, 2025.
- ^ a b c d e f g h i j k l m n o p q r s "The Cook Political Report – Charts – 2010 House Competitive Races". The Cook Political Report. November 1, 2010. Archived from the original on November 4, 2010. Retrieved November 1, 2010.
- ^ a b c d e f g h i j k l m n o p q r s Rothenberg Political Report (November 1, 2010). "House Ratings". Rothenbergpoliticalreport.com. Archived from the original on November 1, 2010. Retrieved November 1, 2010.
- ^ a b c d e f g h i j k l m n o p q r s Crystal Ball, as of November 1, 2010
- ^ a b c d e f g h i j k l m n o p q r s RealClearPolitics, as of November 1, 2010
- ^ a b c d e f g h i j k l m n o p q r s "2010 House Ratings Chart". CQ Politics. Archived from the original on October 28, 2010. Retrieved November 1, 2010.
- ^ a b c d e f g h i j k l m n o p q r s t u v w x y z aa ab ac ad ae af ag ah ai aj ak al "House Race Ratings". nytimes.com. The New York Times. Archived from the original on November 7, 2010. Retrieved October 9, 2023.
- ^ a b c "2010 General Election - Representative in Congress". Commonwealth of PA - Elections Information. Pennsylvania Department of State. 2010. Retrieved May 18, 2013.
- ^ The Hill/ANG Alliance
- ^ Franklin-Marshall
- ^ The Polling Company
- ^ a b c Franklin-Marshall
- ^ Kanjorski wins easily; eyes Barletta rematch Archived 2012-03-08 at the Wayback Machine, The Times Leader, Wilkes-Barre, PA, Timesleader.com. Retrieved on 2010-07-12.
- ^ Morning Call/Muhlenberg Archived 2011-09-27 at the Wayback Machine
- ^ "Pennsylvania Primary Results". Fox News. Archived from the original on May 23, 2010.
- ^ "Congressional, Presidential and Political News, Blogs, Member Profiles". CQ Politics. Archived from the original on February 24, 2009. Retrieved August 21, 2010.
External links
- Pennsylvania Secretary of State Archived February 12, 2012, at the Wayback Machine
- Official election results Archived December 10, 2011, at the Wayback Machine
- Official general information for voting, no candidate lists
- U.S. Congress Candidates for Pennsylvania at Project Vote Smart
- Pennsylvania U.S. House from OurCampaigns.com
- Campaign contributions for U.S. Congressional races in Pennsylvania from OpenSecrets
- 2010 Pennsylvania General Election graph of multiple polls from Pollster.com
- House - Pennsylvania from the Cook Political Report