The 2008 congressional elections in Massachusetts were held on November 4, 2008, to determine who will represent the U.S. state of Massachusetts in the United States House of Representatives . Representatives are elected for two-year terms; whoever is elected will serve in the 111th Congress from January 4, 2009, until January 3, 2011. The election coincides with the 2008 U.S. presidential election .
Massachusetts has ten seats in the House, apportioned according to the 2000 United States census . Its 2007-2008 congressional delegation consisted of ten Democrats . This remains unchanged, and CQ Politics had forecasted all districts safe for its Democratic incumbent.
Overview
United States House of Representatives elections in Massachusetts, 2008[ 1]
Party
Votes
Percentage
Seats
+/–
Democratic
2,245,778
86.21%
10
+1.36%
Republican
318,461
12.22%
0
+1.90%
Independents
40,875
1.57%
0
-3.25%
Totals
2,605,114
100.00%
10
—
District 1
Massachusetts's 1st congressional district John Olver since June, 1991.
Predictions
District 2
Massachusetts's 2nd congressional district Richard Neal since 1989.
Predictions
District 3
Massachusetts's 3rd congressional district Jim McGovern since 1997.
Predictions
District 4
Massachusetts's 4th congressional district South Coast region. It has been represented by Democrat Barney Frank since 1981.
Predictions
District 5
Massachusetts's 5th congressional district Niki Tsongas since October, 2007.
Predictions
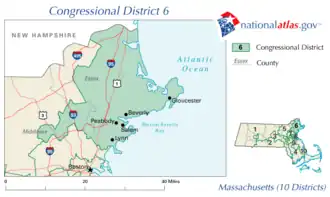
District 6
Massachusetts's 6th congressional district John Tierney since 1997.
Predictions
District 7
Massachusetts's 7th congressional district Boston suburbs. It has been represented by Democrat Edward J. Markey since 1976.
Predictions
District 8
Massachusetts's 8th congressional district Boston and the immediately adjacent cities of Cambridge , Somerville , and Chelsea . It has been represented by Democrat Mike Capuano since 1999.
Predictions
District 9
Massachusetts's 9th congressional district Boston and some of its southern suburbs. It has been represented by Democrat Stephen Lynch since October 2001.
Predictions
District 10
Massachusetts's 10th congressional district South Shore and all of Cape Cod and The Islands. It has been represented by Democrat Bill Delahunt since 1997.
Predictions
References
^ "2008 Election Statistics" . clerk.house.gov .^ a b c d e f g h i j "2008 Competitive House Race Chart" . House: Race Ratings . The Cook Political Report . November 6, 2006. Archived from the original on November 6, 2008. Retrieved November 20, 2023 .^ a b c d e f g h i j "2008 House Ratings" . House Ratings . The Rothenberg Political Report. November 2, 2006. Archived from the original on November 6, 2008. Retrieved November 20, 2023 .^ a b c d e f g h i j "2008 House" . Sabato's Crystal Ball. November 6, 2008. Archived from the original on November 6, 2008. Retrieved November 20, 2023 .^ a b c d e f g h i j "Battle for the House of Representatives" . realclearpolitics.com . Real Clear Politics. November 7, 2008. Archived from the original on December 17, 2008. Retrieved December 9, 2023 .^ a b c d e f g h i j "Race Ratings Chart: House" . cqpolitics.com . Congressional Quarterly Inc. Archived from the original on November 6, 2008. Retrieved November 20, 2023 .
External links
U.S. U.S. Senate U.S. House (election ) Governors Attorneys Other
Pennsylvania
Washington
Wisconsin
State Mayors
Augusta, GA
Bakersfield, CA Baton Rouge, LA Fresno, CA Honolulu, HI Irvine, CA Mesa, AZ Milwaukee, WI Orlando, FL Portland, OR Sacramento, CA San Diego, CA San Juan, PR Santa Ana, CA Stockton, CA Virginia Beach, VA Local
Bay County, MI
DeKalb County, GA
Miami Dade County, FL
New Castle County, DE
Oakland County, MI
Summit County, OH
Will County, IL
States and territories