Scotland constituency election results in the 1929 United Kingdom general election
| 33rd Parliament | (1923) |
| 34th Parliament | (1924) |
| 35th Parliament | (1929) |
| 36th Parliament | (1931) |
| 37th Parliament | (1935) |
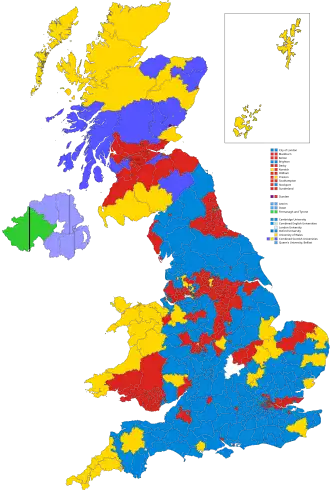
This is a complete alphabetical list of election results from constituencies in Scotland to the 35th Parliament of the United Kingdom at the 1929 general election, held on 30 May 1929.
Scotland
- Change in % vote and swing is calculated between the winner and second place and their respective performances at the 1924 election. A plus denotes a swing to the winner and a minus against the winner.
| Constituency | County | Region | Last election |
Winning party | Turnout [a] |
Votes | |||||||||||||
|---|---|---|---|---|---|---|---|---|---|---|---|---|---|---|---|---|---|---|---|
| Party | Votes | Share | Majority | Labour[b] | Unionist[c] | Liberal | Other[d] | Total | |||||||||||
| # | % | # | % | # | % | # | % | ||||||||||||
| Aberdeenshire Central[1] | Uni | Uni | 10,773 | 43.6 | 1,233 | 63.0 | 4,357 | 17.7 | 10,773 | 43.6 | 9,540 | 38.7 | |||||||
| Aberdeenshire East[2] | Uni | Uni | 13,354 | 56.9 | 3,244 | 10,110 | 43.1 | 13,354 | 56.9 | ||||||||||
| Aberdeenshire West & Kincardine[1] | Uni | Lib | 9,839 | 51.8 | 668 | 66.3 | 9,171 | 48.2 | 9,839 | 51.8 | |||||||||
| Aberdeen North[1] | Lab | Lab | 17,826 | 60.8 | 8,027 | 17,826 | 60.8 | 9,799 | 33.4 | 1,686 | 5.8 | ||||||||
| Aberdeen South[1] | Uni | Uni | 21,548 | 60.8 | 7,680 | 67.2 | 13,868 | 39.2 | 21,548 | 60.8 | |||||||||
| Argyllshire[3] | Uni | Uni | 11,108 | 44.1 | 3,019 | 62.7 | 6,001 | 23.8 | 11,108 | 44.1 | 8,089 | 32.1 | |||||||
| Ayr Burghs[1] | Uni | Uni | 16,874 | 45.9 | 3,445 | 74.8 | 13,429 | 36.5 | 16,874 | 45.9 | 6,479 | 17.6 | |||||||
| Bute & Northern Ayrshire[2] | Uni | Uni | 18,331 | 56.2 | 4,037 | 14,294 | 43.8 | 18,331 | 56.2 | ||||||||||
| Ayrshire South[2] | Lab | Lab | 16,981 | 58.1 | 4,741 | 16,981 | 58.1 | 12,240 | 41.9 | ||||||||||
| Banffshire[2] | Uni | Lib | 9,278 | 44.3 | 2,558 | 4,982 | 23.7 | 6,720 | 32.0 | 9,278 | 44.3 | ||||||||
| Berwick and Haddington[2] | Uni | Lab | 11,761 | 37.5 | 326 | 11,761 | 37.5 | 11,435 | 36.5 | 8,132 | 26.0 | ||||||||
| Bothwell[4] | Lab | Lab | 17,006 | 55.3 | 4,929 | 17,006 | 55.3 | 12,077 | 39.3 | 1,677 | 5.3 | ||||||||
| Caithness and Sutherland | Lib | Lib | 13,462 | 73.9 | 10,421 | 66.5 | 3,041 | 16.7 | 13,462 | 73.9 | 1,711 | 9.4 | |||||||
| Coatbridge[2] | Lab | Lab | 16,879 | 55.0 | 7,669 | 16,879 | 55.0 | 9,210 | 30.0 | 4,610 | 15.0 | ||||||||
| Dumbarton Burghs[1] | Lab | Lab | 19,193 | 63.1 | 7,968 | 19,193 | 63.1 | 11,225 | 36.9 | ||||||||||
| Dumfriesshire[5] | Uni | Lib | 16,174 | 45.1 | Majority | 6,687 | 18.7 | 12,984 | 36.2 | 16,174 | 45.1 | ||||||||
| Dunbartonshire[2] | Uni | Lab | 18,153 | 45.7 | 1,577 | 81.0 | 18,153 | 45.7 | 16,576 | 41.6 | 5,071 | 12.7 | |||||||
| Dunfermline Burghs | Lab | Lab | 15,288 | 58.5 | 6,142 | 74.1 | 15,288 | 58.5 | 9,146 | 35.0 | 1,712 | 6.5 | |||||||
| Edinburgh Central[1] | Lab | Lab | 16,762 | 59.0 | 10,017 | 69.3 | 16,762 | 59.0 | 4,889 | 17.2 | 6,745 | 23.8 | |||||||
| Edinburgh East | Lab | Lab | 13,933 | 47.2 | 5,246 | 13,933 | 47.2 | 6,889 | 17.8 | 8,687 | 29.4 | ||||||||
| Edinburgh North[1] | Uni | Uni | 13,993 | 39.7 | 2,653 | 73.8 | 11,340 | 32.2 | 13,993 | 39.7 | 9,877 | 28.1 | |||||||
| Edinburgh South[6] | Uni | Uni | 19,541 | 56.7 | 9,692 | 5,050 | 14.7 | 19,541 | 56.7 | 9,849 | 28.6 | ||||||||
| Edinburgh West[1] | Uni | Lab | 15,795 | 38.6 | 2,829 | 15,795 | 38.6 | 12,966 | 31.7 | 12,126 | 29.7 | ||||||||
| Fife East | Uni | Lib | 14,329 | 42.9 | 581 | 73.3 | 5,350 | 16.0 | 13,748 | 41.1 | 14,329 | 42.9 | |||||||
| Fife West | Lab | Lab | 17,668 | 60.0 | 11,628 | 69.7 | 17,668 | 60.0 | 5,727 | 19.5 | 6,040 | 20.5 | |||||||
| Forfarshire[2] | Uni | Uni | 8,852 | 42.2 | 1,951 | 70.7 | 5,257 | 25.0 | 8,852 | 42.2 | 6,901 | 32.8 | |||||||
| Galloway[2] | Uni | Lib | 13,461 | 42.4 | 101 | 80.1 | 4,903 | 15.5 | 13,360 | 42.1 | 13,461 | 42.4 | |||||||
| Glasgow Bridgeton[7] | Lab | Lab | 21,033 | 67.7 | 10,984 | 21,033 | 67.7 | 10,049 | 32.3 | ||||||||||
| Glasgow Camlachie[1] | Lab | Lab | 17,946 | 53.2 | 3,786 | 17,946 | 53.2 | C# | C% | 1,646 | 4.9 | ||||||||
| Glasgow Cathcart[1] | Uni | Uni | 15,435 | 43.1 | 2,452 | 12,983 | 36.3 | 15,435 | 43.1 | 7,388 | 20.6 | ||||||||
| Glasgow Central[1] | Uni | Uni | 18,336 | 50.9 | 673 | 72.0 | 17,663 | 49.1 | 18,336 | 50.9 | |||||||||
| Glasgow Gorbals[1] | Lab | Lab | 25,134 | 74.8 | 16,677 | 25,134 | 74.8 | 8,457 | 25.2 | ||||||||||
| Glasgow Govan[5] | Ind | Ind | 17,384 | 57.7 | 4,646 | 12,738 | 42.3 | 17,834 | 57.7 | ||||||||||
| Glasgow Hillhead[1] | Uni | Uni | 17,395 | 63.3 | 7,330 | 74.9 | 10,065 | 36.7 | 17,395 | 63.3 | |||||||||
| Glasgow Kelvingrove[1] | Uni | Uni | 17,031 | 48.9 | 1,858 | 74.9 | 15,173 | 43.6 | 17,031 | 48.9 | 2,623 | 7.5 | |||||||
| Glasgow Maryhill[5] | Uni | Lab | 18,311 | 50.6 | 3,389 | 79.8 | 18,311 | 50.6 | 14,922 | 41.2 | 2,955 | 8.2 | |||||||
| Party | Candidate | Votes | % | ±% | |
|---|---|---|---|---|---|
| Labour | Adam McKinlay | 13,110 | 45.5 | +3.3 | |
| Unionist | George Broun-Lindsay | 12,701 | 44.1 | −13.7 | |
| Liberal | John Taylor | 2,975 | 10.3 | n/a | |
| Majority | 409 | 1.4 | 17.0 | ||
| Turnout | 28,786 | ||||
| Labour gain from Unionist | Swing | +8.5 | |||
| Party | Candidate | Votes | % | ±% | |
|---|---|---|---|---|---|
| Unionist | John Gilmour | 22,328 | 69.2 | ||
| Labour | Walter Muter | 9,936 | 30.8 | ||
| Majority | 12,392 | 38.4 | |||
| Turnout | 32,264 | ||||
| Unionist hold | Swing | ||||
| Party | Candidate | Votes | % | ±% | |
|---|---|---|---|---|---|
| Labour | John Wheatley | 19,594 | 60.4 | +9.1 | |
| Unionist | Herbert James Moss | 12,870 | 39.6 | −9.1 | |
| Majority | 6,724 | 20.8 | |||
| Turnout | 76.9 | −4.9 | |||
| Labour hold | Swing | +9.1 | |||
| Party | Candidate | Votes | % | ±% | |
|---|---|---|---|---|---|
| Labour | George Hardie | 21,079 | 65.5 | +9.0 | |
| Unionist | John McSkimming | 11,110 | 34.5 | −9.0 | |
| Majority | 9,969 | 31.0 | +18.0 | ||
| Turnout | 32,189 | 73.6 | −5.7 | ||
| Labour hold | Swing | +9.0 | |||
| Party | Candidate | Votes | % | ±% | |
|---|---|---|---|---|---|
| Labour | James Stewart | 19,445 | 61.8 | ||
| Unionist | A.N. Forman | 11,430 | 36.3 | n/a | |
| Communist | George Middleton | 613 | 1.9 | n/a | |
| Majority | 8,015 | 25.5 | |||
| Turnout | 31,488 | ||||
| Labour hold | Swing | n/a | |||
| Party | Candidate | Votes | % | ±% | |
|---|---|---|---|---|---|
| Labour | Tom Henderson | 17,864 | 58.7 | ||
| Unionist | Ingram Spencer | 12,592 | 41.3 | n/a | |
| Majority | 5,272 | 17.3 | |||
| Turnout | 30,456 | ||||
| Labour hold | Swing | n/a | |||
| Party | Candidate | Votes | % | ±% | |
|---|---|---|---|---|---|
| Liberal | Godfrey Collins | 11,190 | 32.5 | −16.1 | |
| Labour | William Leonard | 9,697 | 28.2 | +5.8 | |
| Communist | Alec Geddes | 7,005 | 20.4 | −8.6 | |
| Unionist | Andrew Dewar Gibb | 6,517 | 18.9 | n/a | |
| Majority | 1,493 | 4.3 | −15.3 | ||
| Turnout | 78.7 | +0.9 | |||
| Liberal hold | Swing | -10.9 | |||
| Party | Candidate | Votes | % | ±% | |
|---|---|---|---|---|---|
| Labour | Duncan Macgregor Graham | 16,595 | 67.1 | +6.3 | |
| Unionist | Robert McLellan | 7,752 | 31.3 | −7.9 | |
| Communist | Frank Moore | 395 | 1.6 | n/a | |
| Majority | 8,843 | 35.8 | +14.2 | ||
| Turnout | 72.2 | −4.3 | |||
| Labour hold | Swing | +7.1 | |||
| Party | Candidate | Votes | % | ±% | |
|---|---|---|---|---|---|
| Liberal | Murdoch Macdonald | 14,042 | 55.3 | −7.3 | |
| Labour | David Norman Mackay | 11,369 | 44.7 | +7.3 | |
| Majority | 2,673 | 10.6 | −14.6 | ||
| Turnout | 25,411 | ||||
| Liberal hold | Swing | -7.3 | |||
| Party | Candidate | Votes | % | ±% | |
|---|---|---|---|---|---|
| Labour | Robert Climie | 17,368 | 48.2 | +0.4 | |
| Unionist | Charles MacAndrew | 10,939 | 30.4 | −21.8 | |
| Liberal | James Rankin Rutherford | 7,700 | 21.4 | N/A | |
| Majority | 6,429 | 17.8 | N/A | ||
| Turnout | 36,007 | 77.8 | −0.7 | ||
| Labour gain from Unionist | Swing | +11.2 | |||
| Party | Candidate | Votes | % | ±% | |
|---|---|---|---|---|---|
| Unionist | Katharine Stewart-Murray | 12,245 | 48.6 | −23.4 | |
| Liberal | George Freeland Barbour | 9,128 | 36.2 | n/a | |
| Labour | W.D. Stewart | 3,834 | 15.2 | −12.8 | |
| Majority | 3,117 | 12.4 | −31.6 | ||
| Turnout | 75.5 | ||||
| Unionist hold | Swing | n/a | |||
| Party | Candidate | Votes | % | ±% | |
|---|---|---|---|---|---|
| Labour | Tom Kennedy | 17,410 | 59.6 | +6.9 | |
| Unionist | Henry Scrymgeour-Wedderburn | 11,805 | 40.4 | n/a | |
| Majority | 5,605 | 19.2 | +13.8 | ||
| Turnout | 72.2 | −9.6 | |||
| Labour hold | Swing | n/a | |||
| Party | Candidate | Votes | % | ±% | |
|---|---|---|---|---|---|
| Labour | Thomas Scott Dickson | 15,054 | 48.7 | ||
| Unionist | Stephen Mitchell | 12,652 | 41.0 | ||
| Liberal | James Mullo Weir | 3,179 | 10.3 | ||
| Majority | 2,402 | 7.8 | |||
| Turnout | 30,885 | ||||
| Labour gain from Unionist | Swing | ||||
| Party | Candidate | Votes | % | ±% | |
|---|---|---|---|---|---|
| Labour | Jennie Lee | 19,884 | 55.9 | +9.4 | |
| Unionist | Mungo Murray | 15,680 | 44.1 | −9.4 | |
| Majority | 4,204 | 11.8 | 18.8 | ||
| Turnout | 78.6 | ||||
| Labour gain from Unionist | Swing | +9.4 | |||
| Party | Candidate | Votes | % | ±% | |
|---|---|---|---|---|---|
| Liberal | Ernest Brown | 20,613 | 56.7 | −2.9 | |
| Labour | Alan H. Paton | 15,715 | 43.3 | +2.9 | |
| Majority | 4,898 | 13.5 | −5.8 | ||
| Turnout | 36,328 | ||||
| Liberal hold | Swing | -2.9 | |||
| Party | Candidate | Votes | % | ±% | |
|---|---|---|---|---|---|
| Labour | Manny Shinwell | 18,063 | 51.6 | ||
| Unionist | Adrian Baillie | 11,241 | 32.1 | ||
| Liberal | John Fraser Orr | 5,722 | 16.3 | n/a | |
| Majority | 6,822 | 19.5 | |||
| Turnout | 35,026 | ||||
| Party | Candidate | Votes | % | ±% | |
|---|---|---|---|---|---|
| Unionist | John Colville | 11,219 | 39.1 | ||
| Labour | Andrew Clarke | 10,779 | 37.5 | ||
| Liberal | David Edwin Keir | 6,726 | 23.4 | n/a | |
| Majority | 440 | 1.6 | |||
| Turnout | |||||
| Unionist hold | Swing | ||||
| Party | Candidate | Votes | % | ±% | |
|---|---|---|---|---|---|
| Liberal | Robert Hutchison | 11,715 | 55.5 | −1.7 | |
| Labour | Thomas Irwin | 9,381 | 44.5 | +1.7 | |
| Majority | 2,334 | 11.0 | −3.4 | ||
| Turnout | 71.3 | +2.8 | |||
| Liberal hold | Swing | -1.7 | |||
| Party | Candidate | Votes | % | ±% | |
|---|---|---|---|---|---|
| Unionist | James Stuart | 8,896 | 43.7 | ||
| Labour | Joseph Forbes Duncan | 6,563 | 32.3 | ||
| Liberal | John Tennant | 4,889 | 24.0 | n/a | |
| Majority | 2,333 | 11.5 | |||
| Turnout | 20,348 | 68.7 | |||
| Unionist hold | Swing | ||||
| Party | Candidate | Votes | % | ±% | |
|---|---|---|---|---|---|
| Labour | James Barr | 16,650 | 58.0 | ||
| Unionist | John Ford | 7,502 | 26.1 | ||
| Liberal | Henry Archibald | 3,597 | 12.5 | ||
| Communist | Isabel Brown | 984 | 3.4 | ||
| Majority | 9,148 | 31.9 | |||
| Turnout | 79.6 | ||||
| Labour hold | Swing | ||||
| Party | Candidate | Votes | % | ±% | |
|---|---|---|---|---|---|
| Liberal | Robert William Hamilton | 8,256 | 60.4 | n/a | |
| Unionist | Basil Neven-Spence | 5,404 | 39.6 | n/a | |
| Majority | 2,852 | 20.8 | n/a | ||
| Turnout | 13,660 | 43.1 | n/a | ||
| Liberal hold | Swing | n/a | |||
| Party | Candidate | Votes | % | ±% | |
|---|---|---|---|---|---|
| Labour | James C. Welsh | 22,425 | 55.8 | +2.3 | |
| Liberal | James McCulloch | 10,640 | 26.5 | −20.0 | |
| Unionist | Minna Cowan | 7,094 | 17.7 | n/a | |
| Majority | 11,785 | 29.3 | |||
| Turnout | |||||
| Labour hold | Swing | ||||
| Party | Candidate | Votes | % | ±% | |
|---|---|---|---|---|---|
| Labour | Joseph Westwood | 11,161 | 45.5 | +4.7 | |
| Unionist | Hylton Murray-Philipson | 7,736 | 31.5 | −3.8 | |
| Liberal | James McGowan | 5,648 | 23.0 | −0.9 | |
| Majority | 3,425 | 14.0 | +8.5 | ||
| Turnout | 75.7 | −3.1 | |||
| Labour hold | Swing | +4.2 | |||
| Party | Candidate | Votes | % | ±% | |
|---|---|---|---|---|---|
| Unionist | Noel Skelton | 14,229 | 40.4 | −9.0 | |
| Liberal | Francis Norie-Miller | 12,699 | 36.1 | +5.7 | |
| Labour | Helen E Gault | 8,291 | 23.5 | +3.3 | |
| Majority | 1,530 | 4.3 | −14.7 | ||
| Turnout | 76.7 | +1.4 | |||
| Unionist hold | Swing | -7.4 | |||
| Party | Candidate | Votes | % | ±% | |
|---|---|---|---|---|---|
| Unionist | Alexander Munro MacRobert | 18,487 | 52.2 | ||
| Labour | John Martin Munro | 16,924 | 47.8 | ||
| Majority | 1,563 | 4.4 | |||
| Turnout | 63,189 | 75.9 | |||
| Unionist hold | Swing | ||||
| Party | Candidate | Votes | % | ±% | |
|---|---|---|---|---|---|
| Labour | Robert Forgan | 14,419 | 46.5 | ||
| Unionist | Alexander Thomson Taylor | 12,183 | 39.4 | ||
| Liberal | Francis Sheed Anderson | 2,682 | 8.7 | n/a | |
| National (Scotland) | Roland Muirhead | 1,667 | 5.4 | n/a | |
| Majority | 2,236 | 7.1 | |||
| Turnout | 81.6 | ||||
| Labour gain from Unionist | Swing | ||||
| Party | Candidate | Votes | % | ±% | |
|---|---|---|---|---|---|
| Liberal | Ian Macpherson | 9,564 | 58.8 | n/a | |
| Labour | Hugh Donald MacIntosh | 6,710 | 41.2 | n/a | |
| Majority | 2,854 | 17.6 | |||
| Turnout | 16,274 | 55.6 | n/a | ||
| Liberal hold | Swing | n/a | |||
| Party | Candidate | Votes | % | ±% | |
|---|---|---|---|---|---|
| Unionist | Walter Montagu Douglas Scott | 13,510 | 38.0 | −7.8 | |
| Liberal | Arthur Robert McDougal | 12,232 | 34.4 | +6.5 | |
| Labour | Robert Gibson | 9,803 | 27.6 | +1.4 | |
| Majority | 1,278 | 3.6 | −14.3 | ||
| Turnout | 35,545 | 78.5 | |||
| Unionist hold | Swing | -7.2 | |||
| Party | Candidate | Votes | % | ±% | |
|---|---|---|---|---|---|
| Labour | William Wright | 17,538 | 52.2 | ||
| Unionist | Arthur Patterson Duffes | 12,249 | 36.5 | ||
| Liberal | James Dunlop MacDougall | 2,945 | 8.8 | ||
| Communist | Alex Moffat | 842 | 2.5 | ||
| Majority | 5,289 | 15.7 | |||
| Turnout | 33,574 | ||||
| Labour hold | Swing | ||||
| Party | Candidate | Votes | % | ±% | |
|---|---|---|---|---|---|
| Labour | Hugh Murnin | 15,408 | 47.4 | −6.5 | |
| Unionist | Douglas Jamieson | 10,164 | 31.3 | n/a | |
| Independent Protestant | A Ratcliffe | 6,902 | 21.3 | n/a | |
| Majority | 5,244 | 16.1 | +7.5 | ||
| Turnout | 79.1 | −2.5 | |||
| Labour hold | Swing | n/a | |||
| Party | Candidate | Votes | % | ±% | |
|---|---|---|---|---|---|
| Labour | Lauchlin MacNeill Weir | 17,667 | 53.2 | +0.6 | |
| Unionist | Harold Mitchell | 8,778 | 26.4 | n/a | |
| Liberal | Edwin James Donaldson | 6,760 | 20.4 | −27.0 | |
| Majority | 8,889 | 26.8 | +21.6 | ||
| Turnout | 33,205 | ||||
| Labour hold | Swing | n/a | |||
| Party | Candidate | Votes | % | ±% | |
|---|---|---|---|---|---|
| Labour | Tom Johnston | 15,179 | 56.7 | ||
| Unionist | Guy Dalrymple Fanshawe | 11,589 | 43.3 | ||
| Majority | 3,590 | 13.4 | |||
| Turnout | 26,768 | ||||
| Labour gain from Unionist | Swing | ||||
| Party | Candidate | Votes | % | ±% | |
|---|---|---|---|---|---|
| Liberal | Thomas Ramsay | 4,877 | 44.1 | −10.1 | |
| Labour | John McK. MacDiarmid | 3,589 | 32.5 | +15.3 | |
| Unionist | Iain MacAlisdair Moffatt-Pender | 2,593 | 23.4 | −5.2 | |
| Majority | 1,288 | 11.6 | −14.0 | ||
| Turnout | 11,059 | 40.5 | +1.4 | ||
| Liberal hold | Swing | -12.7 | |||
Notes
- ^ Excludes spoilt ballots
- ^ Includes Labour Party and allied Co-operative Party
- ^ Excludes Speaker
- ^ Includes all other parties, all independent candidates and the Speaker
References
- ^ a b c d e f g h i j k l m n o p q r s t u v w x British Parliamentary Election Results 1918–1949, FWS Craig
- ^ a b c d e f g h i j k l m n o p q r s t u v The Times, 1 June 1929
- ^ a b The Times, 3 June 1929
- ^ a b Oliver & Boyd's Edinburgh Almanac, 1927
- ^ a b c The Times House of Commons, 1929
- ^ Oliver and Boyd's Edinburgh Almanack, 1930
- ^ The Constitutional Year Book, 1930