São Jacinto (parish)
São Jacinto | |
|---|---|
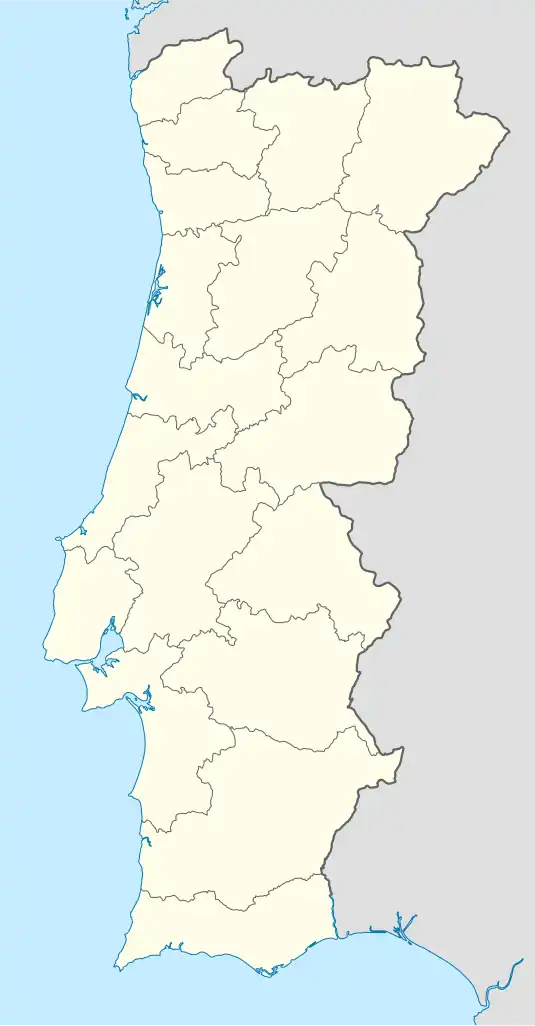 São Jacinto Location in Portugal | |
| Coordinates: 40°39′47″N 8°43′41″W / 40.663°N 8.728°W | |
| Country | |
| Region | Centro |
| Intermunic. comm. | Região de Aveiro |
| District | Aveiro |
| Municipality | Aveiro |
| Area | |
• Total | 13.84 km2 (5.34 sq mi) |
| Population (2011) | |
• Total | 993 |
| • Density | 72/km2 (190/sq mi) |
| Time zone | UTC+00:00 (WET) |
| • Summer (DST) | UTC+01:00 (WEST) |
São Jacinto is a civil parish in the municipality of Aveiro, Aveiro District, Portugal. The population in 2011 was 993,[1] in an area of 13.84 km2.[2] It is situated between the Aveiro Lagoon and the Atlantic Ocean. The São Jacinto Dunes Natural Reserve lies north of the village.
Climate
São Jacinto has a warm-summer Mediterranean climate with warm, dry summers and mild, wet winters.
| Climate data for São Jacinto Airport, 1961-1990 normals and extremes | |||||||||||||
|---|---|---|---|---|---|---|---|---|---|---|---|---|---|
| Month | Jan | Feb | Mar | Apr | May | Jun | Jul | Aug | Sep | Oct | Nov | Dec | Year |
| Record high °C (°F) | 17.1 (62.8) |
18.8 (65.8) |
22.6 (72.7) |
26.2 (79.2) |
31.5 (88.7) |
34.8 (94.6) |
36.4 (97.5) |
36.8 (98.2) |
35.8 (96.4) |
30 (86) |
23.6 (74.5) |
20.0 (68.0) |
36.8 (98.2) |
| Mean daily maximum °C (°F) | 13.8 (56.8) |
14.4 (57.9) |
15.9 (60.6) |
16.8 (62.2) |
18.4 (65.1) |
20.8 (69.4) |
22.2 (72.0) |
22.0 (71.6) |
21.9 (71.4) |
20.0 (68.0) |
16.8 (62.2) |
14.4 (57.9) |
18.1 (64.6) |
| Daily mean °C (°F) | 10.0 (50.0) |
10.8 (51.4) |
12.1 (53.8) |
13.2 (55.8) |
15.1 (59.2) |
17.3 (63.1) |
18.6 (65.5) |
18.3 (64.9) |
18.1 (64.6) |
16.2 (61.2) |
12.9 (55.2) |
10.6 (51.1) |
14.4 (58.0) |
| Mean daily minimum °C (°F) | 6.3 (43.3) |
7.2 (45.0) |
8.2 (46.8) |
9.6 (49.3) |
11.6 (52.9) |
13.8 (56.8) |
15.0 (59.0) |
14.6 (58.3) |
14.2 (57.6) |
12.4 (54.3) |
9.1 (48.4) |
6.9 (44.4) |
10.7 (51.3) |
| Record low °C (°F) | −2.0 (28.4) |
−1.4 (29.5) |
−1.5 (29.3) |
0.8 (33.4) |
4.0 (39.2) |
7.6 (45.7) |
9.0 (48.2) |
5.0 (41.0) |
6.5 (43.7) |
2.6 (36.7) |
0.6 (33.1) |
−1.8 (28.8) |
−2.0 (28.4) |
| Average precipitation mm (inches) | 113.7 (4.48) |
122.6 (4.83) |
72.5 (2.85) |
69.1 (2.72) |
58.7 (2.31) |
29.8 (1.17) |
9.4 (0.37) |
10.4 (0.41) |
36.1 (1.42) |
80.8 (3.18) |
111.1 (4.37) |
126.8 (4.99) |
841 (33.1) |
| Average precipitation days (≥ 0.1 mm) | 16.3 | 15.3 | 14.2 | 13.6 | 11.6 | 8.4 | 3.9 | 4.0 | 7.6 | 11.9 | 14.8 | 13.8 | 135.4 |
| Average relative humidity (%) | 80 | 79 | 74 | 74 | 75 | 76 | 77 | 79 | 79 | 78 | 79 | 80 | 78 |
| Source: Instituto de Meteorologia[3] | |||||||||||||
References
- ^ Instituto Nacional de Estatística
- ^ Áreas das freguesias, concelhos, distritos e país
- ^ "Plano Municipal de Defesa da Floresta Contra Incêndios" (PDF). Ovar Municipality. Retrieved 19 June 2021.
Parishes of Aveiro Municipality | ||
|---|---|---|