Results of the 2025 Australian federal election in territories
2025 Australian federal election |
|---|
| National results |
| State and territory results |
This is a list of electoral division results for the 2025 Australian federal election in the Australian Capital Territory and the Northern Territory.
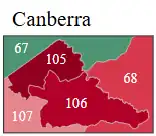
Australian Capital Territory
| |||||||||||||||||||||||||||||||||||||
All 3 Australian Capital Territory seats in the Australian House of Representatives and all 2 seats in the Australian Senate | |||||||||||||||||||||||||||||||||||||
|---|---|---|---|---|---|---|---|---|---|---|---|---|---|---|---|---|---|---|---|---|---|---|---|---|---|---|---|---|---|---|---|---|---|---|---|---|---|
| |||||||||||||||||||||||||||||||||||||
 | |||||||||||||||||||||||||||||||||||||
.jpg)

Overall results in the Australian Capital Territory
| Party | Votes | % | Swing (pp) | Seats | Change (seats) | |||
|---|---|---|---|---|---|---|---|---|
| Labor | 138,110 | 47.53 | +2.64 | 3 | ||||
| Liberal | 61,489 | 21.16 | −5.35 | 0 | ||||
| Greens | 43,753 | 15.06 | −3.61 | 0 | ||||
| Family First | 7,426 | 2.56 | +2.56 | 0 | ||||
| Animal Justice | 1,258 | 0.43 | +0.43 | 0 | ||||
| HEART | 1,222 | 0.42 | +0.42 | 0 | ||||
| Independent | 37,307 | 12.84 | +8.30 | 0 | ||||
| Total | 290,565 | 100.00 | 3 | |||||
| Invalid/blank votes | 7,231 | 2.43 | −0.03 | – | – | |||
| Turnout | 297,796 | 92.41 | +0.34 | – | – | |||
| Registered voters | 322,356 | – | – | – | – | |||
| Two-party-preferred vote | ||||||||
| Labor | 210,627 | 72.49 | +5.54 | |||||
| Liberal | 79,938 | 27.51 | −5.54 | |||||
| Source: AEC | ||||||||
Results by division
Bean
| Party | Candidate | Votes | % | ±% | |
|---|---|---|---|---|---|
| Labor | David Smith | 42,158 | 41.05 | −0.68 | |
| Independent | Jessie Price | 27,120 | 26.41 | +26.41 | |
| Liberal | David Lamerton | 23,665 | 23.04 | −6.68 | |
| Greens | Sam Carter | 9,757 | 9.50 | −5.30 | |
| Total formal votes | 102,700 | 97.47 | +0.35 | ||
| Informal votes | 2,670 | 2.53 | −0.35 | ||
| Turnout | 105,370 | 92.53 | −0.05 | ||
| Notional two-party-preferred count | |||||
| Labor | David Smith | 71,161 | 69.29 | +6.34 | |
| Liberal | David Lamerton | 31,539 | 30.71 | −6.34 | |
| Two-candidate-preferred result | |||||
| Labor | David Smith | 51,700 | 50.34 | −12.61 | |
| Independent | Jessie Price | 51,000 | 49.66 | +49.66 | |
| Labor hold | |||||
Canberra
| Party | Candidate | Votes | % | ±% | |
|---|---|---|---|---|---|
| Labor | Alicia Payne | 45,133 | 48.32 | +3.44 | |
| Greens | Isabel Mudford | 18,504 | 19.81 | −4.88 | |
| Liberal | Will Roche | 17,101 | 18.31 | −3.46 | |
| Independent | Claire Miles | 10,187 | 10.91 | +10.91 | |
| Animal Justice | Teresa McTaggart | 1,258 | 1.35 | +1.35 | |
| HEART | Mary-Jane Liddicoat | 1,222 | 1.31 | +1.31 | |
| Total formal votes | 93,405 | 97.88 | −0.35 | ||
| Informal votes | 2,021 | 2.12 | +0.35 | ||
| Turnout | 95,426 | 92.70 | +0.62 | ||
| Notional two-party-preferred count | |||||
| Labor | Alicia Payne | 71,378 | 76.42 | +3.96 | |
| Liberal | Will Roche | 22,027 | 23.58 | −3.96 | |
| Two-candidate-preferred result | |||||
| Labor | Alicia Payne | 64,936 | 69.52 | +7.32 | |
| Greens | Isabel Mudford | 28,469 | 30.48 | −7.32 | |
| Labor hold | Swing | +7.32 | |||
Fenner
| Party | Candidate | Votes | % | ±% | |
|---|---|---|---|---|---|
| Labor | Andrew Leigh | 50,819 | 53.80 | +5.49 | |
| Liberal | Bola Olatunbosun | 20,723 | 21.94 | −5.90 | |
| Greens | Dani Hunterford | 15,492 | 16.40 | −0.35 | |
| Family First | Elizabeth Kikkert | 7,426 | 7.86 | +7.86 | |
| Total formal votes | 94,460 | 97.38 | +0.08 | ||
| Informal votes | 2,540 | 2.62 | −0.08 | ||
| Turnout | 97,000 | 92.01 | +0.50 | ||
| Two-party-preferred result | |||||
| Labor | Andrew Leigh | 68,088 | 72.08 | +6.39 | |
| Liberal | Bola Olatunbosun | 26,372 | 27.92 | −6.39 | |
| Labor hold | Swing | +6.39 | |||
Northern Territory
| |||||||||||||||||||||||||||||||||||||
All 2 Northern Territory seats in the Australian House of Representatives and all 2 seats in the Australian Senate | |||||||||||||||||||||||||||||||||||||
|---|---|---|---|---|---|---|---|---|---|---|---|---|---|---|---|---|---|---|---|---|---|---|---|---|---|---|---|---|---|---|---|---|---|---|---|---|---|
| |||||||||||||||||||||||||||||||||||||
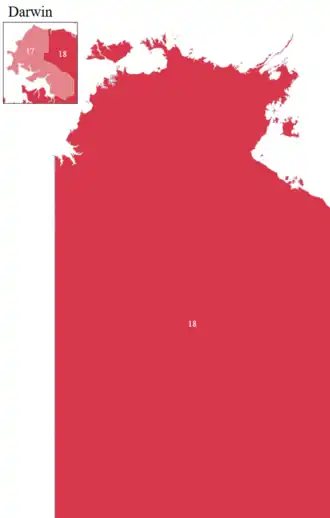 | |||||||||||||||||||||||||||||||||||||
Overall results in the Northern Territory
| Party | Votes | % | Swing (pp) | Seats | Change (seats) | |||
|---|---|---|---|---|---|---|---|---|
| Labor | 40,123 | 37.94 | −0.22 | 2 | ||||
| Country Liberal | 35,785 | 33.84 | +4.45 | 0 | ||||
| Greens | 10,813 | 10.22 | −2.84 | 0 | ||||
| One Nation | 8,165 | 7.72 | +2.35 | 0 | ||||
| Citizens | 1,365 | 1.29 | +0.80 | 0 | ||||
| Indigenous-Aboriginal | 1,317 | 1.25 | +1.25 | 0 | ||||
| Independent | 8,194 | 7.75 | +6.41 | 0 | ||||
| Total | 105,762 | 100.00 | 2 | |||||
| Invalid/blank votes | 4,397 | 3.99 | −1.32 | – | – | |||
| Turnout | 110,159 | 70.83 | +1.16 | – | – | |||
| Registered voters | 155,559 | – | – | – | – | |||
| Two-party-preferred vote | ||||||||
| Labor | 57,377 | 54.25 | –1.29 | |||||
| Country Liberal | 48,385 | 45.75 | +1.29 | |||||
| Source: AEC | ||||||||
Results by division
Lingiari
| Party | Candidate | Votes | % | ±% | |
|---|---|---|---|---|---|
| Labor | Marion Scrymgour | 20,372 | 44.64 | +7.39 | |
| Country Liberal | Lisa Siebert | 14,143 | 30.99 | −3.48 | |
| Greens | Blair McFarland | 4,646 | 10.18 | −0.84 | |
| One Nation | Sakellarios Bairamis | 4,132 | 9.06 | +3.77 | |
| Indigenous-Aboriginal | Chris Tomlins | 1,317 | 2.89 | +2.89 | |
| Citizens | Peter Flynn | 1,022 | 2.24 | +1.18 | |
| Total formal votes | 45,632 | 95.49 | +2.95 | ||
| Informal votes | 2,157 | 4.51 | −2.95 | ||
| Turnout | 47,789 | 62.21 | +1.79 | ||
| Two-candidate-preferred result | |||||
| Labor | Marion Scrymgour | 26,524 | 58.13 | +6.53 | |
| Country Liberal | Lisa Siebert | 19,108 | 41.87 | −6.53 | |
| Labor hold | Swing | +6.53 | |||
Solomon
| Party | Candidate | Votes | % | ±% | |
|---|---|---|---|---|---|
| Country Liberal | Lisa Bayliss | 21,642 | 35.99 | +10.28 | |
| Labor | Luke Gosling | 19,751 | 32.85 | −5.97 | |
| Independent | Phil Scott | 7,501 | 12.47 | +12.47 | |
| Greens | Jonathan Parry | 6,167 | 10.26 | −4.28 | |
| One Nation | Benjamin Craker | 4,033 | 6.71 | +1.28 | |
| Independent | Janey Davies | 693 | 1.15 | +1.15 | |
| Citizens | Brian Kristo | 343 | 0.57 | +0.49 | |
| Total formal votes | 60,130 | 96.41 | +0.10 | ||
| Informal votes | 2,240 | 3.59 | −0.10 | ||
| Turnout | 62,370 | 79.25 | +0.49 | ||
| Two-candidate-preferred result | |||||
| Labor | Luke Gosling | 30,853 | 51.31 | −7.09 | |
| Country Liberal | Lisa Bayliss | 29,277 | 48.69 | +7.09 | |
| Labor hold | Swing | −7.09 | |||
References
- ^ Bean, ACT, 2025 Tally Room, Australian Electoral Commission.
- ^ Canberra, ACT, 2025 Tally Room, Australian Electoral Commission.
- ^ Fenner, ACT, 2025 Tally Room, Australian Electoral Commission.
- ^ Lingiari, NT, 2025 Tally Room, Australian Electoral Commission.
- ^ Solomon, NT, 2025 Tally Room, Australian Electoral Commission.
| ||
| Campaign |  | |
| Results | ||