List of ethnic origins of New Zealanders
In the most recent New Zealand census, in 2018, 70.2 per cent of the population identified as European and 16.5 per cent as Māori. Other major pan-ethnic groups include Asians (15.1 per cent) and Pacific peoples (8.1 per cent). Middle Eastern, Latin American and African ethnicities constitute a small remainder (1.5 per cent) of the population. When completing the census people could select more than one ethnic group and this list includes all of the stated ethnic groups if more than one is chosen.[1]
New Zealand's ethnic diversity can be attributed to its history and location. For example, the country's colonisation by the UK is a core reason for its Western values and culture.
Terminology
The New Zealand census invites respondents to identify with an ethnic group.[2]
There are six major ethnic groupings:[3]
- European New Zealanders (Pākehā) are a European ethnic group. It includes New Zealanders of European descent, European peoples (e.g. British, Irish, Dutch, German, Russian, Italian, Greek), and other peoples of indirect European descent (e.g. Americans, Canadians, Australians and South Africans,).
- Māori are the indigenous people of New Zealand.
- Pacific peoples (Pasifika) originate from other islands in the Pacific, including from the Cook Islands, Niue, and Tokelau, all of which are dependent states of New Zealand, as well as other places like Tuvalu, Palau, The Pitcairn Islands and Fiji.[4]
- Asian New Zealanders are a pan-ethnic group deriving from various nations in the Asian continent, such as Chinese, Japanese, Koreans, Indians, Filipinos, Vietnamese or their descendants.
- Middle Eastern, Latin American, African (MELAA), and Caribbean ethnicities constitute a very small remainder of the population.
- "Other" is a grouping of ethnic groups which do not fit into the other five top-level ethnic groups.
Handling multiple ethnicities
Many respondents identify with multiple ancestries.[1] Outputting data on multiple ethnicities is normally handled one of two ways: total response or prioritised ethnicity. For this list, the total response method is used.
Total response counts people of multiple ethnicities in each ethnic groups in which they identify. While this shows all the people that identify with a particular ethnicities, the sum of all ethnic group populations adds to more than the total population. For example, a person who identifies as New Zealand European and Māori would be counted twice, once under each ethnicity, under total response output.[5]
Prioritised ethnicity counts people with multiple ethnicities in the highest-priority single ethnic group in which they identify. The order of priority for ethnicity, from highest to lowest, is Māori, Pacific peoples, Asian, MELAA, other and European. While it has the advantage that the sum of all ethnic groups equals the total population, the preferential order can cause ethnic groups to be overrepresented or underrepresented, and may categorise a person differently from their self-identified primary ethnicity. For example, a person who identifies as New Zealand European and Māori would be counted under the Māori ethnic group under prioritised ethnicity output.[5]
Ethnicities
Only ethnicities with 1,000 or more responses at the 2023 census are included individually:
| Code | Ethnicity | Ethnic group | Responses | ||
|---|---|---|---|---|---|
| 2013[6] | 2018[7] | 2023 | |||
| 11111 | New Zealand European | European | 2,727,009 | 3,013,440 | 3,099,858 |
| 21111 | Māori | Māori | 598,605 | 775,836 | 887,493 |
| 42100 | Chinese nfd | Asian | 163,101 | 231,387 | 259,755 |
| 43100 | Indian nfd | Asian | 143,520 | 221,916 | 255,261 |
| 31111 | Samoan | Pacific | 144,138 | 182,721 | 213,069 |
| 41111 | Filipino | Asian | 40,350 | 72,612 | 108,297 |
| 33111 | Tongan | Pacific | 60,333 | 82,389 | 97,824 |
| 32100 | Cook Islands Māori nfd | Pacific | 61,077 | 80,532 | 94,176 |
| 12114 | English | European | 38,916 | 72,204 | 68,517 |
| 12948 | South African European | European | 28,656 | 37,155 | 48,930 |
| 61118 | New Zealander | Other | 65,973 | 45,330 | 42,684 |
| 44311 | Korean | Asian | 30,171 | 35,664 | 38,944 |
| 34111 | Niuean | Pacific | 23,883 | 30,867 | 34,944 |
| 12211 | Dutch | European | 28,503 | 29,820 | 30,948 |
| 12811 | Australian | European | 22,467 | 29,349 | 30,591 |
| 36111 | Fijian | Pacific | 14,445 | 19,722 | 25,038 |
| 43112 | Fijian Indian | Asian | 10,929 | 15,132 | 23,808 |
| 10000 | European nfd | European | 26,472 | 34,632 | 21,834 |
| 12116 | Irish | European | 14,193 | 17,835 | 21,261 |
| 12119 | Scottish | European | 14,412 | 18,627 | 19,767 |
| 44211 | Japanese | Asian | 14,118 | 18,141 | 19,488 |
| 12943 | American | European | 12,339 | 16,245 | 18,606 |
| 12711 | German | European | 12,810 | 16,818 | 17,565 |
| 52100 | Latin American nfd | MELAA | 5,622 | 9,798 | 15,861 |
| 44111 | Sinhalese | Asian | 1,017 | 9,171 | 14,436 |
| 41311 | Vietnamese | Asian | 6,660 | 10,086 | 14,157 |
| 41415 | Thai | Asian | 8,052 | 10,623 | 12,858 |
| 40000 | Asian nfd | Asian | 4,623 | 11,811 | 12,645 |
| 12100 | British nfd | European | 36,024 | 11,607 | 12,021 |
| 41211 | Cambodian | Asian | 8,601 | 9,672 | 11,514 |
| 51100 | Middle Eastern nfd | MELAA | 4,380 | 8,268 | 10,245 |
| 35111 | Tokelauan | Pacific | 7,173 | 8,676 | 9,822 |
| 52113 | Brazilian | MELAA | 2,868 | 6,663 | 9,216 |
| 43116 | Sikh | Asian | 213 | 192 | 9,111 |
| 61117 | Other South African | Other | 255 | 6,816 | 8,919 |
| 12945 | Canadian | European | 5,871 | 7,797 | 8,910 |
| 44411 | Afghani | Asian | 3,417 | 5,250 | 8,721 |
| 12924 | French | European | 4,593 | 7,677 | 8,451 |
| 41000 | Southeast Asian nfd | Asian | 1,272 | 6,219 | 8,235 |
| 42116 | Taiwanese | Asian | 5,715 | 6,570 | 8,163 |
| 44414 | Pakistani | Asian | 3,261 | 6,135 | 8,094 |
| 12935 | Russian | European | 5,979 | 7,713 | 8,040 |
| 41412 | Indonesian | Asian | 4,137 | 6,033 | 7,614 |
| 44413 | Nepalese | Asian | 1,590 | 3,630 | 6,948 |
| 37144 | Tuvaluan | Pacific | 3,537 | 4,653 | 6,585 |
| 12611 | Italian | European | 3,798 | 5,352 | 6,444 |
| 53100 | African nfd | MELAA | 6,822 | 7,221 | 6,402 |
| 12949 | Afrikaner | European | 1,197 | 789 | 6,069 |
| 42113 | Malaysian Chinese | Asian | 1,848 | 4,866 | 5,865 |
| 12121 | Welsh | European | 3,708 | 4,971 | 5,724 |
| 51115 | Iranian/Persian | MELAA | 3,198 | 4,425 | 5,613 |
| 44100 | Sri Lankan nfd | Asian | 9,561 | 4,245 | 5,100 |
| 41414 | Malaysian | Asian | 4,797 | 3,729 | 4,797 |
| 37124 | Kiribati | Pacific | 2,115 | 3,225 | 4,659 |
| 44112 | Sri Lankan Tamil | Asian | 732 | 3,501 | 4,221 |
| 43115 | Punjabi | Asian | 324 | 459 | 4,152 |
| 52114 | Chilean | MELAA | 1,686 | 2,886 | 4,083 |
| 12511 | Croatian | European | 2,673 | 2,946 | 3,609 |
| 44412 | Bangladeshi | Asian | 1,623 | 2,337 | 3,552 |
| 42111 | Hong Kong Chinese | Asian | 222 | 3,177 | 3,501 |
| 41411 | Burmese | Asian | 2,187 | 2,475 | 3,453 |
| 12411 | Polish | European | 2,163 | 2,871 | 3,360 |
| 12939 | Spanish | European | 2,043 | 2,773 | 3,162 |
| 12941 | Swiss | European | 2,388 | 2,649 | 2,880 |
| 52111 | Argentinian | MELAA | 726 | 1,824 | 2,826 |
| 12311 | Greek | European | 2,478 | 2,475 | 2,823 |
| 53127 | Other Zimbabwean | MELAA | 1,068 | 2,760 | |
| 51117 | Israeli/Jewish | MELAA | 1,353 | 1,854 | 2,757 |
| 51112 | Arab | MELAA | 2,919 | 2,994 | 2,640 |
| 12999 | European nec | European | 2,637 | 1,968 | 2,562 |
| 12920 | Danish | European | 1,986 | 2,214 | 2,496 |
| 51116 | Iraqi | MELAA | 2,583 | 2,688 | 2,490 |
| 53119 | Somali | MELAA | 1,617 | 1,701 | 2,376 |
| 43119 | South African Indian | Asian | 1,632 | 2,340 | |
| 30000 | Pacific Peoples nfd | Pacific | 1,026 | 2,724 | 2,271 |
| 52115 | Colombian | MELAA | 654 | 1,620 | 2,226 |
| 41499 | Southeast Asian nec | Asian | 723 | 1,638 | 2,223 |
| 61199 | Other ethnicity nec | Other | 150 | 4,017 | 2,163 |
| 12942 | Ukrainian | European | 852 | 1,281 | 2,151 |
| 53121 | Ethiopian | MELAA | 1,242 | 1,635 | 2,151 |
| 12940 | Swedish | European | 1,401 | 1,911 | 2,127 |
| 37140 | Tahitian | Pacific | 1,407 | 1,737 | 2,019 |
| 52123 | Mexican | MELAA | 711 | 1,425 | 1,965 |
| 12919 | Czech | European | 1,083 | 1,740 | 1,953 |
| 53199 | African nec | MELAA | 1,158 | 1,005 | 1,929 |
| 51120 | Lebanese | MELAA | 1,044 | 1,278 | 1,878 |
| 41413 | Laotian | Asian | 1,374 | 1,608 | 1,860 |
| 51114 | Egyptian | MELAA | 1,110 | 1,533 | 1,854 |
| 12926 | Hungarian | European | 1,365 | 1,638 | 1,788 |
| 51127 | Turkish | European | 957 | 1,320 | 1,779 |
| 12932 | Portuguese | European | 942 | 1,365 | 1,746 |
| 61113 | Indigenous American | Other | 750 | 1,278 | 1,623 |
| 12950 | Zimbabwean European | European | 1,617 | 1,872 | 1,497 |
| 42112 | Cambodian Chinese | Asian | 132 | 1,413 | 1,467 |
| 12933 | Romanian | European | 1,452 | 1,485 | 1,437 |
| 12931 | Norwegian | European | 810 | 1,131 | 1,410 |
| 53115 | Nigerian | MELAA | 291 | 636 | 1,365 |
| 12514 | Serbian | European | 1,056 | 1,284 | 1,347 |
| 12913 | Austrian | European | 1,029 | 1,272 | 1,338 |
| 37138 | Rotuman | Pacific | 783 | 981 | 1,323 |
| 44416 | Eurasian | Asian | 1,365 | 1,389 | 1,296 |
| 37135 | Papua New Guinean | Pacific | 807 | 1,131 | 1,290 |
| 53118 | Caribbean | MELAA | 807 | 1,047 | 1,284 |
| 37112 | Indigenous Australian | Pacific | 453 | 795 | 1,161 |
| 37145 | Ni Vanuatu | Pacific | 492 | 990 | 1,161 |
| 41417 | Chin | Asian | 834 | 1,110 | |
| 51113 | Assyrian | MELAA | 1,497 | 1,293 | 1,101 |
| 53116 | African American | MELAA | 510 | 855 | 1,083 |
| 43114 | Indian Tamil | Asian | 300 | 315 | 1,074 |
| 99999 | Not specifieda | 230,646 | 0 | ||
- nfd – Not Further Defined (insufficient data to classify the response further)
- nec – Not Elsewhere Classified (when no category exists for the response)
- a – Includes Don't Know, Refused to Answer, Response Unidentifiable, Response Outside Scope and Not Stated
- MELAA – Middle Eastern, Latin American and African
Ethnic groups by area
By region
| Region | European | Maori | Pacific | Asian | MELAA | Other | ||||||
|---|---|---|---|---|---|---|---|---|---|---|---|---|
| Num. | % | Num. | % | Num. | % | Num. | % | Num. | % | Num. | % | |
| Northland | 141,594 | 73.0 | 72,612 | 37.4 | 9,486 | 4.9 | 9,345 | 4.8 | 1,263 | 0.7 | 2,208 | 1.1 |
| Auckland | 825,144 | 49.8 | 203,544 | 12.3 | 275,079 | 16.6 | 518,178 | 31.3 | 44,718 | 2.7 | 15,144 | 0.9 |
| Waikato | 357,624 | 71.7 | 125,574 | 25.2 | 26,139 | 5.2 | 60,792 | 12.2 | 7,146 | 1.4 | 5,742 | 1.2 |
| Bay of Plenty | 240,087 | 71.9 | 102,387 | 30.6 | 14,202 | 4.3 | 29,262 | 8.8 | 3,954 | 1.2 | 3,558 | 1.1 |
| Gisborne | 28,905 | 56.5 | 28,029 | 54.8 | 2,841 | 5.6 | 1,968 | 3.8 | 381 | 0.7 | 468 | 0.9 |
| Hawke's Bay | 128,415 | 73.3 | 50,076 | 28.6 | 10,902 | 6.2 | 11,361 | 6.5 | 1,398 | 0.8 | 2,118 | 1.2 |
| Taranaki | 105,366 | 83.6 | 27,411 | 21.8 | 3,234 | 2.6 | 7,215 | 5.7 | 699 | 0.8 | 1,719 | 1.4 |
| Manawatu-Whanganui | 196,431 | 78.1 | 63,177 | 25.1 | 12,522 | 5.0 | 19,329 | 7.7 | 1,836 | 1.0 | 3,339 | 1.3 |
| Wellington | 378,429 | 72.6 | 80,613 | 15.5 | 47,349 | 9.1 | 79,314 | 15.2 | 11,934 | 2.3 | 5,823 | 1.1 |
| North Island | 2,401,995 | 63.1 | 753,423 | 19.3 | 401,754 | 10.6 | 736,764 | 19.3 | 74,166 | 1.9 | 40,119 | 1.1 |
| Tasman | 52,416 | 90.7 | 5,745 | 9.9 | 1,509 | 2.6 | 2,298 | 4.0 | 435 | 0.8 | 915 | 1.6 |
| Nelson | 44,544 | 84.7 | 6,252 | 11.9 | 1,485 | 2.8 | 4,533 | 8.6 | 714 | 1.4 | 705 | 1.3 |
| Marlborough | 42,450 | 85.9 | 7,344 | 14.9 | 1,821 | 3.7 | 2,667 | 5.4 | 738 | 1.5 | 744 | 1.5 |
| West Coast | 29,964 | 89.7 | 4,491 | 13.5 | 540 | 1.6 | 1,335 | 4.0 | 180 | 0.5 | 723 | 2.2 |
| Canterbury | 522,498 | 80.3 | 69,060 | 10.6 | 23,868 | 3.7 | 86,430 | 13.3 | 10,299 | 1.6 | 8,205 | 1.3 |
| Otago | 205,224 | 85.2 | 23,910 | 9.9 | 8,274 | 3.4 | 20,379 | 8.5 | 5,211 | 2.2 | 3,207 | 1.3 |
| Southland | 84,195 | 84.1 | 16,848 | 16.8 | 3,351 | 3.3 | 7,152 | 7.1 | 1,014 | 1.0 | 1,509 | 1.5 |
| South Island | 981,291 | 82.8 | 133,650 | 10.5 | 40,848 | 3.4 | 124,794 | 10.5 | 18,591 | 1.6 | 16,008 | 1.4 |
| New Zealand | 3,383,742 | 67.8 | 887,493 | 19.8 | 442,632 | 8.9 | 861,576 | 17.3 | 92,760 | 1.9 | 56,133 | 1.1 |
In images
-
 European from 2006 to 2018
 -
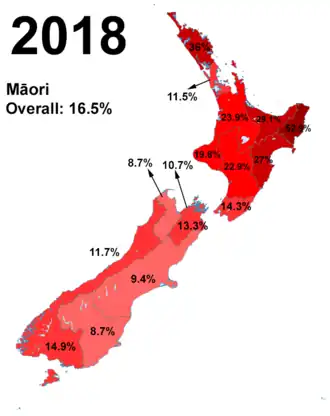 Māori in 2018
 -
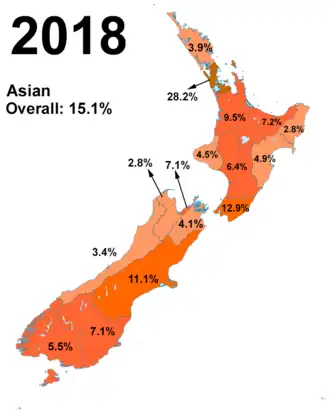 Asian in 2018
 -
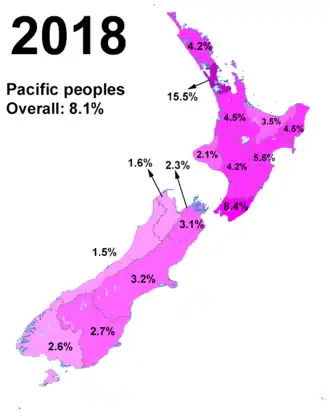 Pacific peoples in 2018
By territorial authority and Auckland local board
| Territorial authority or Auckland local board | European | Māori | Pacific | Asian | ||||
|---|---|---|---|---|---|---|---|---|
| Num. | % | Num. | % | Num. | % | Num. | % | |
| Far North district | 46,131 | 64.6 | 35,679 | 49.9 | 3,834 | 5.4 | 2,265 | 3.2 |
| Whangarei district | 73,776 | 76.3 | 30,351 | 31.4 | 4,398 | 4.5 | 6,153 | 6.4 |
| Kaipara district | 21,687 | 83.7 | 6,579 | 25.4 | 1,254 | 4.8 | 927 | 3.6 |
| Auckland | 825,144 | 49.8 | 203,544 | 12.3 | 275,079 | 16.6 | 518,178 | 31.3 |
| Auckland – Rodney local board area | 66,204 | 84.9 | 9,543 | 12.2 | 3,324 | 4.3 | 7,341 | 9.4 |
| Auckland – Hibiscus and Bays local board area | 86,598 | 75.9 | 8,169 | 7.2 | 2,790 | 2.4 | 23,436 | 20.6 |
| Auckland – Upper Harbour local board area | 37,794 | 49.1 | 4,713 | 6.1 | 2,418 | 3.1 | 34,983 | 45.5 |
| Auckland – Kaipātiki local board area | 49,785 | 56.5 | 8,328 | 9.4 | 5,835 | 6.6 | 30,669 | 34.8 |
| Auckland – Devonport-Takapuna local board area | 38,493 | 66.4 | 3,603 | 6.2 | 1,695 | 2.9 | 16,842 | 29.0 |
| Auckland – Henderson-Massey local board area | 54,420 | 43.6 | 22,629 | 18.1 | 27,669 | 22.2 | 39,546 | 31.7 |
| Auckland – Waitākere Ranges local board area | 37,737 | 70.0 | 7,452 | 13.8 | 7,104 | 13.2 | 9,405 | 17.4 |
| Auckland – Aotea/Great Barrier local board area | 1,122 | 89.7 | 285 | 22.8 | 27 | 2.2 | 21 | 1.7 |
| Auckland – Waiheke local board area | 8,061 | 88.0 | 1,125 | 12.3 | 333 | 3.6 | 417 | 4.6 |
| Auckland – Waitematā local board area | 48,819 | 59.9 | 6,876 | 8.4 | 4,725 | 5.8 | 25,692 | 31.5 |
| Auckland – Whau local board area | 30,522 | 37.6 | 8,913 | 11.0 | 16,050 | 19.7 | 34,332 | 42.2 |
| Auckland – Albert-Eden local board area | 56,025 | 58.0 | 8,322 | 8.6 | 8,343 | 8.6 | 31,953 | 33.1 |
| Auckland – Puketāpapa local board area | 18,261 | 32.1 | 3,795 | 6.7 | 8,931 | 15.7 | 28,701 | 50.4 |
| Auckland – Ōrākei local board area | 56,937 | 68.4 | 5,316 | 6.4 | 3,072 | 3.7 | 22,215 | 26.7 |
| Auckland – Maungakiekie-Tāmaki local board area | 32,973 | 42.2 | 11,013 | 14.1 | 20,190 | 25.9 | 23,370 | 29.9 |
| Auckland – Howick local board area | 58,503 | 38.1 | 9,717 | 6.3 | 12,339 | 8.0 | 80,565 | 52.5 |
| Auckland – Māngere-Ōtāhuhu local board area | 14,466 | 18.4 | 13,302 | 16.9 | 47,463 | 60.4 | 15,408 | 19.6 |
| Auckland – Ōtara-Papatoetoe local board area | 12,678 | 14.6 | 13,749 | 15.8 | 42,381 | 48.7 | 30,792 | 35.4 |
| Auckland – Manurewa local board area | 24,213 | 24.5 | 24,858 | 25.2 | 39,450 | 39.9 | 27,249 | 27.6 |
| Auckland – Papakura local board area | 26,541 | 36.7 | 17,811 | 24.6 | 14,811 | 20.5 | 24,732 | 34.2 |
| Auckland – Franklin local board area | 64,986 | 77.0 | 14,019 | 16.6 | 6,129 | 7.3 | 10,509 | 12.5 |
| Thames-Coromandel district | 28,287 | 88.4 | 6,003 | 18.8 | 789 | 2.5 | 1,143 | 3.6 |
| Hauraki district | 17,829 | 83.6 | 5,139 | 24.1 | 777 | 3.6 | 969 | 4.5 |
| Waikato district | 63,252 | 73.6 | 23,088 | 26.9 | 4,704 | 5.5 | 7,821 | 9.1 |
| Matamata-Piako district | 30,903 | 83.3 | 6,888 | 18.6 | 981 | 2.6 | 2,547 | 6.9 |
| Hamilton city | 102,180 | 58.5 | 44,445 | 25.4 | 11,862 | 6.8 | 39,798 | 22.8 |
| Waipa district | 50,748 | 86.5 | 9,303 | 15.9 | 1,332 | 2.3 | 3,552 | 6.1 |
| Ōtorohanga district | 7,944 | 76.3 | 3,384 | 32.5 | 330 | 3.2 | 453 | 4.4 |
| South Waikato district | 17,271 | 69.0 | 9,585 | 38.3 | 3,378 | 13.5 | 1,248 | 5.0 |
| Waitomo district | 6,000 | 62.6 | 4,341 | 45.3 | 426 | 4.4 | 477 | 5.0 |
| Taupo district | 30,198 | 74.9 | 12,453 | 30.9 | 1,479 | 3.7 | 2,625 | 6.5 |
| Western Bay of Plenty district | 45,003 | 80.1 | 12,111 | 21.6 | 1,899 | 3.4 | 4,113 | 7.3 |
| Tauranga city | 120,345 | 78.7 | 29,562 | 19.3 | 5,430 | 3.6 | 15,726 | 10.3 |
| Rotorua district | 45,588 | 61.6 | 32,199 | 43.5 | 4,716 | 6.4 | 7,443 | 10.1 |
| Whakatane district | 23,145 | 62.3 | 18,054 | 48.6 | 1,431 | 3.9 | 1,590 | 4.3 |
| Kawerau district | 4,053 | 53.8 | 4,764 | 63.2 | 357 | 4.7 | 252 | 3.3 |
| Ōpōtiki district | 5,013 | 49.7 | 6,678 | 66.2 | 456 | 4.5 | 318 | 3.2 |
| Gisborne district | 28,905 | 56.5 | 28,029 | 54.8 | 2,841 | 5.6 | 1,968 | 3.8 |
| Wairoa district | 4,140 | 46.9 | 6,048 | 68.5 | 375 | 4.2 | 150 | 1.7 |
| Hastings district | 60,132 | 69.9 | 24,435 | 28.4 | 7,320 | 8.5 | 6,513 | 7.6 |
| Napier city | 51,096 | 79.0 | 15,651 | 24.2 | 2,724 | 4.2 | 4,224 | 6.5 |
| Central Hawke's Bay district | 12,987 | 83.9 | 3,903 | 25.2 | 483 | 3.1 | 456 | 2.9 |
| New Plymouth district | 73,092 | 84.0 | 17,358 | 20.0 | 2,199 | 2.5 | 5,727 | 6.6 |
| Stratford district | 9,156 | 90.2 | 1,587 | 15.6 | 177 | 1.7 | 345 | 3.4 |
| South Taranaki district | 23,265 | 80.2 | 8,496 | 29.3 | 861 | 3.0 | 1,152 | 4.0 |
| Ruapehu district | 9,009 | 68.8 | 5,979 | 45.7 | 456 | 3.5 | 474 | 3.6 |
| Whanganui district | 37,284 | 78.3 | 13,566 | 28.5 | 1,965 | 4.1 | 2,415 | 5.1 |
| Rangitikei district | 12,468 | 79.6 | 4,422 | 28.2 | 867 | 5.5 | 462 | 2.9 |
| Manawatu district | 28,521 | 88.0 | 5,946 | 18.3 | 897 | 2.8 | 1,089 | 3.4 |
| Palmerston North city | 64,239 | 73.8 | 18,042 | 20.7 | 5,169 | 5.9 | 12,498 | 14.4 |
| Tararua district | 15,678 | 84.0 | 5,013 | 26.9 | 495 | 2.7 | 585 | 3.1 |
| Horowhenua district | 29,091 | 79.3 | 10,149 | 27.7 | 2,667 | 7.3 | 1,797 | 4.9 |
| Kapiti Coast district | 48,438 | 86.6 | 8,826 | 15.8 | 2,097 | 3.8 | 3,468 | 6.2 |
| Porirua city | 35,733 | 60.1 | 13,668 | 23.0 | 15,753 | 26.5 | 6,834 | 11.5 |
| Upper Hutt city | 35,853 | 78.4 | 7,650 | 16.7 | 2,991 | 6.5 | 5,460 | 11.9 |
| Lower Hutt city | 69,168 | 64.3 | 21,072 | 19.6 | 13,125 | 12.2 | 19,977 | 18.6 |
| Wellington city | 146,208 | 72.1 | 19,878 | 9.8 | 11,565 | 5.7 | 41,436 | 20.4 |
| Masterton district | 23,163 | 83.7 | 6,267 | 22.6 | 1,260 | 4.6 | 1,413 | 5.1 |
| Carterton district | 9,222 | 91.2 | 1,428 | 14.1 | 234 | 2.3 | 312 | 3.1 |
| South Wairarapa district | 10,638 | 90.1 | 1,821 | 15.4 | 324 | 2.7 | 411 | 3.5 |
| Tasman district | 52,416 | 90.7 | 5,745 | 9.9 | 1,509 | 2.6 | 2,298 | 4.0 |
| Nelson city | 44,544 | 84.7 | 6,252 | 11.9 | 1,485 | 2.8 | 4,533 | 8.6 |
| Marlborough district | 42,450 | 85.9 | 7,344 | 14.9 | 1,821 | 3.7 | 2,667 | 5.4 |
| Kaikoura district | 3,669 | 87.0 | 801 | 19.0 | 42 | 1.0 | 165 | 3.9 |
| Buller district | 9,459 | 90.6 | 1,362 | 13.0 | 177 | 1.7 | 348 | 3.3 |
| Grey district | 12,309 | 90.7 | 1,662 | 11.8 | 192 | 1.4 | 564 | 4.0 |
| Westland district | 7,758 | 87.2 | 1,470 | 16.5 | 174 | 2.0 | 420 | 4.7 |
| Hurunui district | 12,309 | 90.5 | 1,368 | 10.1 | 177 | 1.3 | 636 | 4.7 |
| Waimakariri district | 61,008 | 92.1 | 6,546 | 9.9 | 1,065 | 1.6 | 2,547 | 3.8 |
| Christchurch city | 296,955 | 75.9 | 44,022 | 11.2 | 16,746 | 4.3 | 67,050 | 17.1 |
| Selwyn district | 65,682 | 84.1 | 7,050 | 9.0 | 1,869 | 2.4 | 8,877 | 11.4 |
| Ashburton district | 28,185 | 81.1 | 3,000 | 8.6 | 2,097 | 6.0 | 3,273 | 9.4 |
| Timaru district | 41,508 | 87.3 | 4,953 | 10.4 | 1,650 | 3.5 | 2,772 | 5.8 |
| Mackenzie district | 4,323 | 84.5 | 447 | 8.7 | 75 | 1.5 | 459 | 9.0 |
| Waimate district | 7,176 | 88.4 | 708 | 8.7 | 123 | 1.5 | 531 | 6.5 |
| Chatham Islands territory | 444 | 72.5 | 420 | 68.6 | 24 | 3.9 | 12 | 2.0 |
| Waitaki district | 19,941 | 85.0 | 2,241 | 9.5 | 1,293 | 5.5 | 1,626 | 6.9 |
| Central Otago district | 21,819 | 89.8 | 2,319 | 9.5 | 591 | 2.4 | 1,089 | 4.5 |
| Queenstown-Lakes district | 39,594 | 82.8 | 3,060 | 6.4 | 696 | 1.5 | 5,001 | 10.5 |
| Dunedin city | 109,635 | 85.1 | 13,914 | 10.8 | 5,037 | 3.9 | 11,961 | 9.3 |
| Clutha district | 15,912 | 86.9 | 2,538 | 13.9 | 675 | 3.7 | 828 | 4.5 |
| Southland district | 27,465 | 86.3 | 4,137 | 13.0 | 453 | 1.4 | 2,409 | 7.6 |
| Gore district | 11,040 | 86.9 | 1,953 | 15.4 | 273 | 2.1 | 504 | 4.0 |
| Invercargill city | 45,687 | 82.2 | 10,764 | 19.4 | 2,625 | 4.7 | 4,242 | 7.6 |
| New Zealand | 3,383,742 | 67.8 | 887,493 | 17.8 | 442,632 | 8.9 | 861,576 | 17.3 |
See also
Citations
- ^ a b "Cultural diversity". 2013 Census QuickStats about national highlights. Statistics New Zealand. 3 December 2013. Retrieved 18 August 2017.
- ^ Rocha, Zarine L. (2015). "Mixed Race" Identities in Asia and the Pacific: Experiences from Singapore and New Zealand. Routledge. p. 27. ISBN 9781317390787. Retrieved 10 December 2017.
- ^ "Classifications and related statistical standards – Ethnicity". Statistics New Zealand. June 2005. Retrieved 13 November 2016.
- ^ Fraenkel, Jon (20 June 2012). "Pacific Islands and New Zealand". Te Ara Encyclopedia of New Zealand. Retrieved 18 August 2017.
- ^ a b "HISO 10001:2017 Ethnicity Data Protocols" (PDF). Ministry of Health (New Zealand). September 2017.
- ^ "Ethnic group profiles". Statistics New Zealand. Retrieved 18 August 2017.
- ^ "2018 Census totals by topic – national highlights | Stats NZ". www.stats.govt.nz. Archived from the original on 23 September 2019. Retrieved 30 September 2019.
- ^ "Ethnicity (detailed total responses level 3), age, and gender for the census usually resident population count, (RC, TALB, SA2, Health), 2013, 2018, and 2023 Censuses". explore.data.stats.govt.nz. Retrieved 10 August 2025.
References
- 2013 Census QuickStats, Statistics New Zealand, 2013, ISBN 978-0-478-40864-5