List of countries by financial assets per capita
This is a list of countries by financial assets per capita.
Mean net financial assets per capita
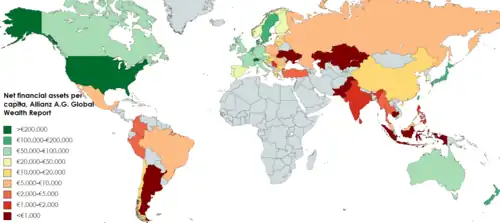
This list shows 57 countries with net financial assets per capita.[1]
| Country | Mean net financial assets per capita (EUR) |
|---|---|
| 253,450 | |
| 238,780 | |
| 163,830 | |
| 151,200 | |
| 141,600 | |
| 117,760 | |
| 117,450 | |
| 116,060 | |
| 103,110 | |
| 97,790 | |
| 96,500 | |
| 92,630 | |
| 92,370 | |
| 89,910 | |
| 88,380 | |
| 71,360 | |
| 69,340 | |
| 65,330 | |
| 63,540 | |
| 49,500 | |
| 41,260 | |
| 38,000 | |
| 35,970 | |
| 34,060 | |
| 29,450 | |
| 26,960 | |
| 26,850 | |
| 22,250 | |
| 19,280 | |
| 18,390 | |
| 17,730 | |
| 17,720 | |
| 16,000 | |
| 15,960 | |
| 14,510 | |
| 14,320 | |
| 11,330 | |
| 11,200 | |
| 9,830 | |
| 9,010 | |
| 9,000 | |
| 8,520 | |
| 8,220 | |
| 7,930 | |
| 5,110 | |
| 3,220 | |
| 3,180 | |
| 1,910 | |
| 1,800 | |
| 1,750 | |
| 1,490 | |
| 1,380 | |
| 1,340 | |
| 1,000 | |
| 960 | |
| 580 | |
| 440 |
Gross financial wealth per adult
This list shows selected countries, sorted by highest financial gross wealth per adult, taken from UBS' Global Wealth Databook.[2] The net average wealth is calculated by subtracting the debt from the mean financial wealth. The adult financial wealth is the total value of financial worth, or the sum of their overall financial assets minus liabilities. Financial wealth takes into account: savings, monetary gold, currency and deposits, stocks, securities and loans. Financial assets include pension and life insurance reserves, which in many cases cannot be withdrawn at one's discretion.
During periods when equity markets experienced strong growth, the relative national and per capita wealth of the countries where people are more exposed on those markets, such as the United States and United Kingdom, tend to rise. On the other hand, when equity markets are depressed, the relative wealth the countries where people invest more in real estate or bonds, such as France and Italy, tend to rise instead. Countries with more aged populations like Germany and Italy would have higher relative wealth, if calculated per capita and not per adult.[3]
* indicates "Income in COUNTRY or TERRITORY" or "Economy of COUNTRY or TERRITORY" links.
| Country | Gross financial wealth per adult (USD) |
|---|---|
| 448,960 | |
| 422,404 | |
| 387,963 | |
| 308,420 | |
| 245,992 | |
| 230,904 | |
| 225,252 | |
| 225,242 | |
| 224,904 | |
| 213,771 | |
| 205,080 | |
| 203,689 | |
| 172,396 | |
| 168,334 | |
| 168,223 | |
| 148,386 | |
| 145,912 | |
| 137,362 | |
| 114,960 | |
| 113,737 | |
| 105,265 | |
| 91,776 | |
| 91,391 | |
| 75,047 | |
| 60,102 | |
| 48,239 | |
| 38,503 | |
| 38,228 | |
| 35,512 | |
| 29,095 | |
| 20,968 | |
| 19,501 | |
| 19,149 | |
| 14,378 | |
| 14,350 | |
| 11,256 | |
| 10,181 | |
| 7,637 | |
| 6,968 | |
| 4,187 | |
| 3,769 |
See also
- List of countries by total wealth
- List of countries by wealth per adult
- List of countries by GNI (nominal) per capita
- List of countries by stock market capitalization
References
- ^ "Global Wealth Report" (PDF). allianz.com.
- ^ "Global Wealth Databook 2023" (PDF). UBS. Retrieved September 27, 2023. Financial assets by adult in selected countries on page 141.
- ^ "Archived copy". Archived from the original on 2017-11-22. Retrieved 2018-04-28.
{{cite web}}: CS1 maint: archived copy as title (link) - ^ "Global Wealth Databook 2022" (PDF). Credit Suisse. Archived (PDF) from the original on October 19, 2022. Retrieved October 19, 2022. Financial assets by adult in selected countries on page 109.
External links
Economic classification of countries | |||||
|---|---|---|---|---|---|
| Three/Four-World Model | |||||
| Gross domestic product (GDP) |
| ||||
| Gross national income and Income | |||||
| Wages and salary | |||||
| Wealth | |||||
| Other national accounts | |||||
| Human development | |||||
| Digital divide | |||||
| Net international investment position (NIIP) | |||||