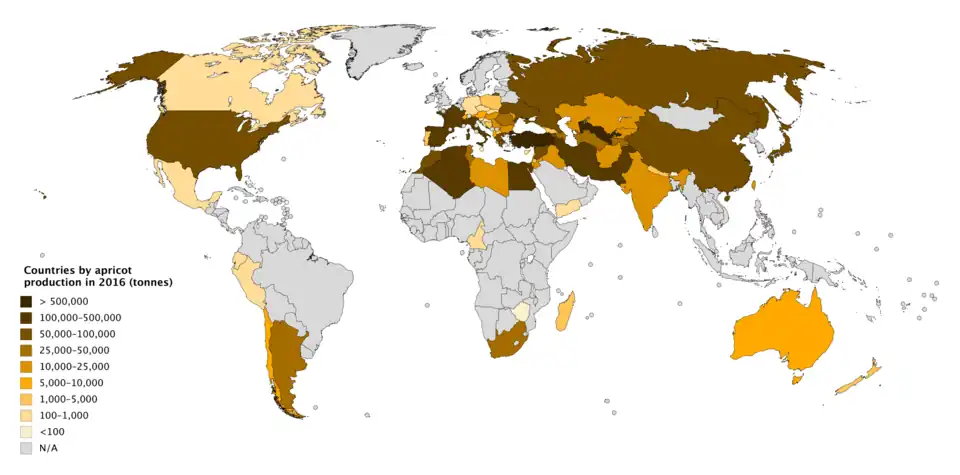
 Countries by apricot production in 2016
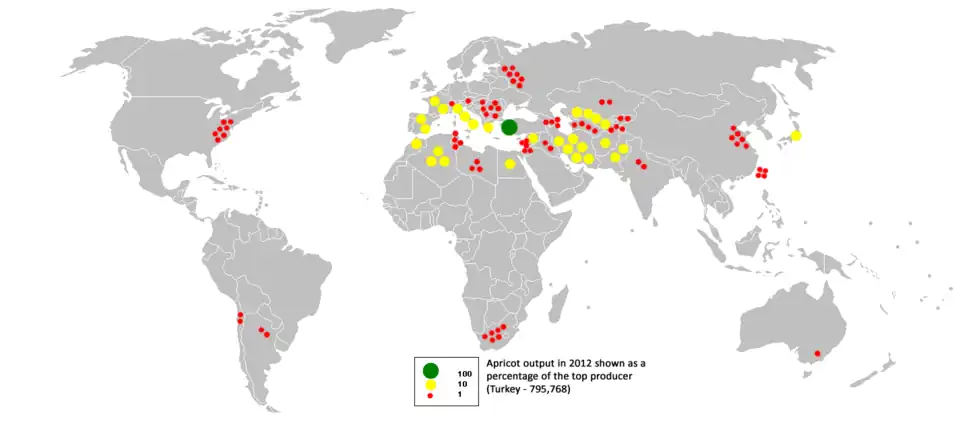 A map of world apricot production, 2012
This is a list of countries by apricot production in 2022 and 2021, based on data from the Food and Agriculture Organization Corporate Statistical Database.[1] The estimated total world production for apricots in 2022 was 3,863,180 metric tonnes, up 6.6% from 3,622,553 tonnes in 2021.[1]
Production by country
>100,000 tonnes
| Rank |
Country/region |
2022 |
2021
|
| – |
World |
3,863,180 |
3,622,553
|
| 1 |
 Turkey Turkey |
803,000 |
800,000
|
| 2 |
 Uzbekistan Uzbekistan |
451,263 |
424,734
|
| 3 |
 Iran Iran |
305,932 |
257,360
|
| 4 |
 Italy Italy |
230,080 |
189,570
|
| 5 |
 Algeria Algeria |
203,916 |
189,724
|
| 6 |
 Pakistan Pakistan |
174,546 |
159,022
|
| 7 |
 Afghanistan Afghanistan |
170,508 |
207,490
|
| 8 |
 France France |
128,080 |
54,590
|
| 9 |
 Armenia Armenia |
113,572 |
86,889
|
| 10 |
 Greece Greece |
112,230 |
76,540
|
50,000–100,000 tonnes
| Rank |
Country/region |
2022 |
2021
|
| 11 |
 Japan Japan |
96,600 |
104,600
|
| 12 |
 Russia Russia |
84,900 |
79,000
|
| 13 |
 Spain Spain |
80,870 |
114,720
|
| 14 |
 Egypt Egypt |
71,979 |
66,207
|
| 15 |
 Morocco Morocco |
68,001 |
78,449
|
| 16 |
.svg.png) Syria Syria |
57,779 |
33,635
|
| 17 |
 China China |
53,325 |
53,533
|
10,000–50,000 tonnes
| Rank |
Country/region |
2022 |
2021
|
| 18 |
 Ukraine Ukraine |
49,710 |
56,840
|
| 19 |
 Serbia Serbia |
44,386 |
31,362
|
| 20 |
 Tunisia Tunisia |
37,000 |
38,000
|
| 21 |
 Turkmenistan Turkmenistan |
34,972 |
34,817
|
| 22 |
 Lebanon Lebanon |
32,639 |
36,610
|
| 23 |
 Iraq Iraq |
31,151 |
34,153
|
| 24 |
 Tajikistan Tajikistan |
31,036 |
31,196
|
| 25 |
 Azerbaijan Azerbaijan |
30,284 |
29,366
|
| 26 |
 South Africa South Africa |
29,276 |
39,520
|
| 27 |
 Libya Libya |
28,189 |
24,424
|
| 28 |
 Argentina Argentina |
27,517 |
27,412
|
| 29 |
 United States United States |
26,890 |
36,260
|
| 30 |
 Kyrgyzstan Kyrgyzstan |
26,067 |
25,985
|
| 31 |
 Kazakhstan Kazakhstan |
24,208 |
23,901
|
| 32 |
 Hungary Hungary |
24,110 |
11,770
|
| 33 |
 Romania Romania |
23,500 |
26,840
|
| 34 |
 Bulgaria Bulgaria |
19,040 |
20,700
|
| 35 |
 Jordan Jordan |
18,793 |
19,225
|
| 36 |
 Taiwan Taiwan |
16,155 |
17,850
|
| 37 |
 India India |
14,874 |
14,983
|
| 38 |
 Moldova Moldova |
11,800 |
8,700
|
1,000–10,000 tonnes
| Rank |
Country/region |
2022 |
2021
|
| 39 |
.svg.png) Switzerland Switzerland |
9,445 |
3,347
|
| 40 |
 Israel Israel |
6,500 |
4,500
|
| 41 |
 Austria Austria |
6,280 |
5,690
|
| 42 |
 Albania Albania |
5,500 |
5,057
|
| 43 |
 North Macedonia North Macedonia |
5,312 |
2,584
|
| 44 |
.svg.png) Australia Australia |
5,267 |
6,154
|
| 45 |
 Poland Poland |
4,600 |
3,100
|
| 46 |
 Chile Chile |
4,562 |
4,580
|
| 47 |
 Bosnia and Herzegovina Bosnia and Herzegovina |
4,117 |
660
|
| 48 |
.svg.png) Portugal Portugal |
4,010 |
3,450
|
| 49 |
 Georgia Georgia |
2,600 |
2,000
|
| 50 |
 Nepal Nepal |
2,226 |
2,009
|
| 51 |
 New Zealand New Zealand |
1,946 |
2,717
|
| 52 |
 Yemen Yemen |
1,722 |
1,726
|
| 53 |
 Czechia Czechia |
1,530 |
1,860
|
| 54 |
 Madagascar Madagascar |
1,485 |
1,478
|
| 55 |
 Mexico Mexico |
1,083 |
1,089
|
| 56 |
 Cyprus Cyprus |
1,000 |
1,040
|
<1,000 tonnes
Notes
References