List of French departments by life expectancy
Metropolitan France is administratively divided into 13 regions. The regions are in turn divided into departments, of which there are 96 in total. In addition, France includes a number of overseas territories, 5 of which have a status equal to departments and regions in the metropolitan area.
According to estimation of the United Nations, in 2023 life expectancy in France was 83.33 years (80.43 for male, 86.09 for female).[1]
Estimation of the World Bank Group for 2023: 82.93 years total (80.10 for male, 85.90 for female).[2]
Estimation of Eurostat for 2023: 83.0 years total (80.1 for male, 85.7 for female).[3][4]
According to estimation of the WHO for 2019, at that year life expectancy in France was 82.5 years (79.8 years for male and 85.1 years for female). And healthy life expectancy was 72.1 years (71.1 years for male and 73.1 years for female).[5]
INSEE (2015—2024)
The official statistics of France, available on the INSEE website, do not include total life expectancy for the population as a whole. For a more correct comparison of regions with various differences in life expectancy for men and women, a column with the arithmetic mean of these indicators was added to the tables.INSEE has been publishing on its website tabular data on life expectancy in regions and departments since 2015. By default tables are sorted by arithmetic mean for 2024.
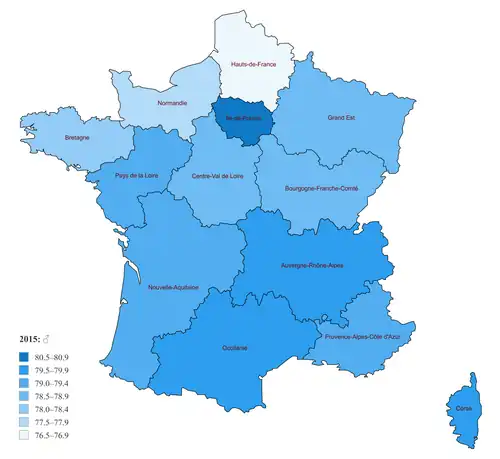
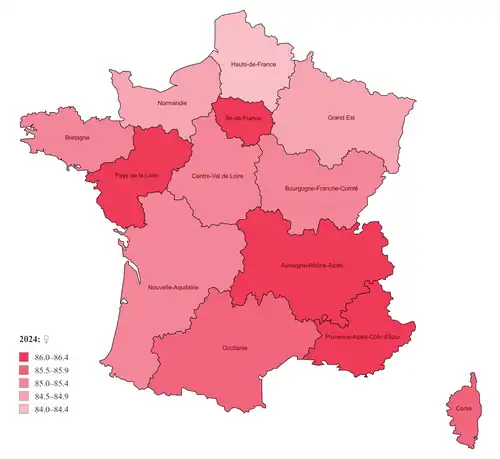
Statistics by region
| region | 2015 | 2015 →2019 |
2019 | 2019 →2024 |
2024 | 2015 →2024 | |||||||||
|---|---|---|---|---|---|---|---|---|---|---|---|---|---|---|---|
| male | female | sex gap | arith. mean | male | female | sex gap | arith. mean | male | female | sex gap | arith. mean | ||||
| Metropolitan France | 79.0 | 85.1 | 6.1 | 82.05 | 0.70 | 79.8 | 85.7 | 5.9 | 82.75 | 0.15 | 80.1 | 85.7 | 5.6 | 82.90 | 0.85 |
| Île-de-France (Paris Region) | 80.6 | 85.6 | 5.0 | 83.10 | 0.65 | 81.4 | 86.1 | 4.7 | 83.75 | 0.25 | 81.7 | 86.3 | 4.6 | 84.00 | 0.90 |
| Corsica | 79.6 | 85.6 | 6.0 | 82.60 | 0.85 | 80.5 | 86.4 | 5.9 | 83.45 | 0.25 | 81.6 | 85.8 | 4.2 | 83.70 | 1.10 |
| Auvergne-Rhône-Alpes | 79.9 | 85.5 | 5.6 | 82.70 | 0.50 | 80.5 | 85.9 | 5.4 | 83.20 | 0.35 | 81.0 | 86.1 | 5.1 | 83.55 | 0.85 |
| Provence-Alpes-Côte d'Azur | 79.4 | 85.3 | 5.9 | 82.35 | 0.45 | 80.0 | 85.6 | 5.6 | 82.80 | 0.55 | 80.7 | 86.0 | 5.3 | 83.35 | 1.00 |
| Pays de la Loire | 79.1 | 85.6 | 6.5 | 82.35 | 0.55 | 79.8 | 86.0 | 6.2 | 82.90 | 0.20 | 80.2 | 86.0 | 5.8 | 83.10 | 0.75 |
| Occitania | 79.6 | 85.4 | 5.8 | 82.50 | 0.30 | 80.1 | 85.5 | 5.4 | 82.80 | 0.20 | 80.3 | 85.7 | 5.4 | 83.00 | 0.50 |
| Nouvelle-Aquitaine | 79.2 | 85.3 | 6.1 | 82.25 | 0.35 | 79.7 | 85.5 | 5.8 | 82.60 | 0.05 | 79.9 | 85.4 | 5.5 | 82.65 | 0.40 |
| Brittany | 78.2 | 84.9 | 6.7 | 81.55 | 0.40 | 78.7 | 85.2 | 6.5 | 81.95 | 0.35 | 79.4 | 85.2 | 5.8 | 82.30 | 0.75 |
| Centre-Val de Loire | 78.9 | 85.0 | 6.1 | 81.95 | 0.30 | 79.3 | 85.2 | 5.9 | 82.25 | 0.05 | 79.4 | 85.2 | 5.8 | 82.30 | 0.35 |
| Bourgogne-Franche-Comté | 78.5 | 84.9 | 6.4 | 81.70 | 0.25 | 78.9 | 85.0 | 6.1 | 81.95 | 0.10 | 79.1 | 85.0 | 5.9 | 82.05 | 0.35 |
| Grand Est | 78.6 | 84.2 | 5.6 | 81.40 | 0.40 | 79.0 | 84.6 | 5.6 | 81.80 | 0.15 | 79.2 | 84.7 | 5.5 | 81.95 | 0.55 |
| Normandy | 77.8 | 84.6 | 6.8 | 81.20 | 0.40 | 78.3 | 84.9 | 6.6 | 81.60 | 0.15 | 78.8 | 84.7 | 5.9 | 81.75 | 0.55 |
| Hauts-de-France | 76.7 | 83.4 | 6.7 | 80.05 | 0.60 | 77.5 | 83.8 | 6.3 | 80.65 | 0.45 | 78.1 | 84.1 | 6.0 | 81.10 | 1.05 |


| region | 2015 | 2015 →2019 |
2019 | 2019 →2024 |
2024 | 2015 →2024 | |||||||||
|---|---|---|---|---|---|---|---|---|---|---|---|---|---|---|---|
| male | female | sex gap | arith. mean | male | female | sex gap | arith. mean | male | female | sex gap | arith. mean | ||||
| France on average | 79.0 | 85.1 | 6.1 | 82.05 | 0.60 | 79.7 | 85.6 | 5.9 | 82.65 | 0.15 | 80.0 | 85.6 | 5.6 | 82.80 | 0.75 |
| Réunion (in the Indian Ocean) | 77.1 | 83.6 | 6.5 | 80.35 | 1.25 | 78.5 | 84.7 | 6.2 | 81.60 | −0.30 | 78.5 | 84.1 | 5.6 | 81.30 | 0.95 |
| Martinique (in the Caribbean) | 79.4 | 84.7 | 5.3 | 82.05 | −0.50 | 78.8 | 84.3 | 5.5 | 81.55 | −0.30 | 78.4 | 84.1 | 5.7 | 81.25 | −0.80 |
| Guadeloupe (in the Caribbean) | 77.0 | 84.8 | 7.8 | 80.90 | −0.35 | 76.4 | 84.7 | 8.3 | 80.55 | −0.90 | 76.0 | 83.3 | 7.3 | 79.65 | −1.25 |
| French Guiana (in South America) | 76.4 | 82.0 | 5.6 | 79.20 | 1.00 | 76.6 | 83.8 | 7.2 | 80.20 | −1.25 | 76.1 | 81.8 | 5.7 | 78.95 | −0.25 |
| Mayotte (in the Indian Ocean) | 75.3 | 77.2 | 1.9 | 76.25 | — | — | — | — | — | — | 72.8 | 75.8 | 3.0 | 74.30 | −1.95 |
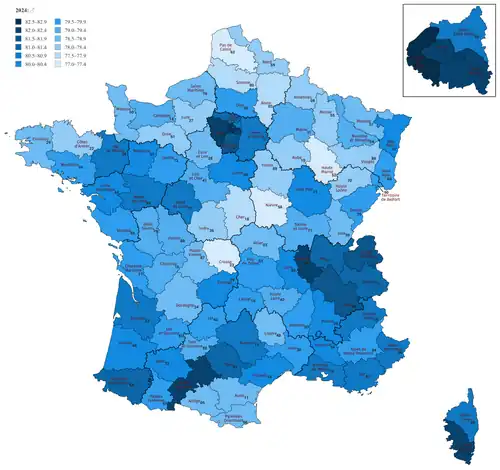
Statistics by department
| code | department | 2015 | 2015 →2019 |
2019 | 2019 →2024 |
2024 | 2015 →2024 | |||||||||
|---|---|---|---|---|---|---|---|---|---|---|---|---|---|---|---|---|
| male | female | sex gap | arith. mean | male | female | sex gap | arith. mean | male | female | sex gap | arith. mean | |||||
| M | Metropolitan France | 79.0 | 85.1 | 6.1 | 82.05 | 0.70 | 79.8 | 85.7 | 5.9 | 82.75 | 0.15 | 80.1 | 85.7 | 5.6 | 82.90 | 0.85 |
| 92 | Hauts-de-Seine | 81.5 | 86.2 | 4.7 | 83.85 | 0.70 | 82.6 | 86.5 | 3.9 | 84.55 | 0.35 | 82.7 | 87.1 | 4.4 | 84.90 | 1.05 |
| 69 | Rhône, Lyon Metropolis | 80.3 | 85.9 | 5.6 | 83.10 | 0.85 | 81.3 | 86.6 | 5.3 | 83.95 | 0.70 | 82.2 | 87.1 | 4.9 | 84.65 | 1.55 |
| 94 | Val-de-Marne | 80.8 | 85.5 | 4.7 | 83.15 | 0.65 | 81.4 | 86.2 | 4.8 | 83.80 | 0.75 | 82.4 | 86.7 | 4.3 | 84.55 | 1.40 |
| 78 | Yvelines | 81.4 | 86.2 | 4.8 | 83.80 | 0.45 | 81.9 | 86.6 | 4.7 | 84.25 | 0.10 | 82.1 | 86.6 | 4.5 | 84.35 | 0.55 |
| 75 | Paris | 81.2 | 86.4 | 5.2 | 83.80 | 0.65 | 82.0 | 86.9 | 4.9 | 84.45 | −0.10 | 82.0 | 86.7 | 4.7 | 84.35 | 0.55 |
| 31 | Haute-Garonne | 81.0 | 86.1 | 5.1 | 83.55 | 0.20 | 81.5 | 86.0 | 4.5 | 83.75 | 0.50 | 82.0 | 86.5 | 4.5 | 84.25 | 0.70 |
| 74 | Haute-Savoie | 80.7 | 85.9 | 5.2 | 83.30 | 0.55 | 81.4 | 86.3 | 4.9 | 83.85 | 0.40 | 81.8 | 86.7 | 4.9 | 84.25 | 0.95 |
| 2A | Corse-du-Sud | 79.7 | 85.2 | 5.5 | 82.45 | 1.15 | 80.8 | 86.4 | 5.6 | 83.60 | 0.60 | 82.4 | 86.0 | 3.6 | 84.20 | 1.75 |
| 38 | Isère | 80.5 | 85.9 | 5.4 | 83.20 | 0.35 | 81.2 | 85.9 | 4.7 | 83.55 | 0.45 | 81.8 | 86.2 | 4.4 | 84.00 | 0.80 |
| 91 | Essonne | 80.7 | 85.8 | 5.1 | 83.25 | 0.60 | 81.5 | 86.2 | 4.7 | 83.85 | 0.05 | 81.6 | 86.2 | 4.6 | 83.90 | 0.65 |
| 73 | Savoie | 80.0 | 85.5 | 5.5 | 82.75 | 0.75 | 80.5 | 86.5 | 6.0 | 83.50 | 0.35 | 81.0 | 86.7 | 5.7 | 83.85 | 1.10 |
| 49 | Maine-et-Loire | 79.8 | 85.8 | 6.0 | 82.80 | 1.05 | 81.0 | 86.7 | 5.7 | 83.85 | −0.10 | 80.8 | 86.7 | 5.9 | 83.75 | 0.95 |
| 01 | Ain | 80.4 | 85.5 | 5.1 | 82.95 | 0.50 | 80.9 | 86.0 | 5.1 | 83.45 | 0.25 | 81.4 | 86.0 | 4.6 | 83.70 | 0.75 |
| 81 | Tarn | 79.8 | 86.1 | 6.3 | 82.95 | −0.15 | 79.8 | 85.8 | 6.0 | 82.80 | 0.85 | 81.3 | 86.0 | 4.7 | 83.65 | 0.70 |
| 64 | Pyrénées-Atlantiques | 79.8 | 85.6 | 5.8 | 82.70 | 0.65 | 80.6 | 86.1 | 5.5 | 83.35 | 0.30 | 81.1 | 86.2 | 5.1 | 83.65 | 0.95 |
| 37 | Indre-et-Loire | 79.6 | 85.9 | 6.3 | 82.75 | 0.35 | 80.0 | 86.2 | 6.2 | 83.10 | 0.55 | 80.8 | 86.5 | 5.7 | 83.65 | 0.90 |
| 35 | Ille-et-Vilaine | 79.7 | 85.5 | 5.8 | 82.60 | 0.55 | 80.2 | 86.1 | 5.9 | 83.15 | 0.45 | 80.8 | 86.4 | 5.6 | 83.60 | 1.00 |
| 05 | Hautes-Alpes | 80.1 | 85.3 | 5.2 | 82.70 | 0.65 | 80.4 | 86.3 | 5.9 | 83.35 | 0.15 | 80.7 | 86.3 | 5.6 | 83.50 | 0.80 |
| 06 | Alpes-Maritimes | 79.6 | 85.7 | 6.1 | 82.65 | 0.50 | 80.5 | 85.8 | 5.3 | 83.15 | 0.30 | 80.7 | 86.2 | 5.5 | 83.45 | 0.80 |
| 83 | Var | 79.6 | 85.4 | 5.8 | 82.50 | 0.10 | 79.7 | 85.5 | 5.8 | 82.60 | 0.80 | 80.7 | 86.1 | 5.4 | 83.40 | 0.90 |
| 13 | Bouches-du-Rhône | 79.4 | 85.1 | 5.7 | 82.25 | 0.60 | 80.0 | 85.7 | 5.7 | 82.85 | 0.50 | 80.8 | 85.9 | 5.1 | 83.35 | 1.10 |
| 53 | Mayenne | 79.6 | 85.6 | 6.0 | 82.60 | 0.40 | 79.9 | 86.1 | 6.2 | 83.00 | 0.30 | 80.4 | 86.2 | 5.8 | 83.30 | 0.70 |
| 2B | Haute-Corse | 79.6 | 85.9 | 6.3 | 82.75 | 0.55 | 80.2 | 86.4 | 6.2 | 83.30 | −0.05 | 80.9 | 85.6 | 4.7 | 83.25 | 0.50 |
| 33 | Gironde | 79.6 | 85.5 | 5.9 | 82.55 | 0.55 | 80.4 | 85.8 | 5.4 | 83.10 | 0.15 | 80.6 | 85.9 | 5.3 | 83.25 | 0.70 |
| 95 | Val-d'Oise | 79.8 | 84.9 | 5.1 | 82.35 | 0.60 | 80.5 | 85.4 | 4.9 | 82.95 | 0.25 | 81.1 | 85.3 | 4.2 | 83.20 | 0.85 |
| 84 | Vaucluse | 78.3 | 84.7 | 6.4 | 81.50 | 0.65 | 79.2 | 85.1 | 5.9 | 82.15 | 1.05 | 80.3 | 86.1 | 5.8 | 83.20 | 1.70 |
| 77 | Seine-et-Marne | 79.3 | 84.7 | 5.4 | 82.00 | 0.95 | 80.4 | 85.5 | 5.1 | 82.95 | 0.10 | 80.6 | 85.5 | 4.9 | 83.05 | 1.05 |
| 93 | Seine-Saint-Denis | 79.1 | 84.4 | 5.3 | 81.75 | 0.60 | 80.0 | 84.7 | 4.7 | 82.35 | 0.70 | 80.5 | 85.6 | 5.1 | 83.05 | 1.30 |
| 34 | Hérault | 79.4 | 85.6 | 6.2 | 82.50 | 0.30 | 79.9 | 85.7 | 5.8 | 82.80 | 0.25 | 80.1 | 86.0 | 5.9 | 83.05 | 0.55 |
| 12 | Aveyron | 80.2 | 85.5 | 5.3 | 82.85 | 0.25 | 80.2 | 86.0 | 5.8 | 83.10 | −0.15 | 80.7 | 85.2 | 4.5 | 82.95 | 0.10 |
| 26 | Drôme | 79.7 | 85.7 | 6.0 | 82.70 | −0.10 | 79.6 | 85.6 | 6.0 | 82.60 | 0.35 | 80.3 | 85.6 | 5.3 | 82.95 | 0.25 |
| 21 | Côte-d'Or | 79.7 | 85.4 | 5.7 | 82.55 | 0.35 | 79.9 | 85.9 | 6.0 | 82.90 | 0.05 | 80.2 | 85.7 | 5.5 | 82.95 | 0.40 |
| 42 | Loire | 79.7 | 85.4 | 5.7 | 82.55 | 0.35 | 80.3 | 85.5 | 5.2 | 82.90 | 0.05 | 80.2 | 85.7 | 5.5 | 82.95 | 0.40 |
| 44 | Loire-Atlantique | 78.6 | 85.7 | 7.1 | 82.15 | 0.50 | 79.5 | 85.8 | 6.3 | 82.65 | 0.30 | 80.1 | 85.8 | 5.7 | 82.95 | 0.80 |
| 04 | Alpes-de-Haute-Provence | 78.9 | 85.3 | 6.4 | 82.10 | 0.05 | 79.6 | 84.7 | 5.1 | 82.15 | 0.80 | 79.9 | 86.0 | 6.1 | 82.95 | 0.85 |
| 40 | Landes | 79.1 | 85.0 | 5.9 | 82.05 | 0.60 | 79.9 | 85.4 | 5.5 | 82.65 | 0.25 | 80.3 | 85.5 | 5.2 | 82.90 | 0.85 |
| 67 | Bas-Rhin | 79.3 | 84.8 | 5.5 | 82.05 | 0.45 | 79.9 | 85.1 | 5.2 | 82.50 | 0.25 | 80.4 | 85.1 | 4.7 | 82.75 | 0.70 |
| 46 | Lot | 79.3 | 84.4 | 5.1 | 81.85 | 0.50 | 79.4 | 85.3 | 5.9 | 82.35 | 0.40 | 79.8 | 85.7 | 5.9 | 82.75 | 0.90 |
| 32 | Gers | 80.5 | 84.3 | 3.8 | 82.40 | 0.10 | 79.4 | 85.6 | 6.2 | 82.50 | 0.20 | 80.1 | 85.3 | 5.2 | 82.70 | 0.30 |
| 85 | Vendée | 79.2 | 85.6 | 6.4 | 82.40 | 0.15 | 79.4 | 85.7 | 6.3 | 82.55 | 0.15 | 79.7 | 85.7 | 6.0 | 82.70 | 0.30 |
| 45 | Loiret | 78.9 | 84.7 | 5.8 | 81.80 | 0.85 | 79.9 | 85.4 | 5.5 | 82.65 | −0.05 | 80.0 | 85.2 | 5.2 | 82.60 | 0.80 |
| 72 | Sarthe | 78.8 | 85.1 | 6.3 | 81.95 | 0.35 | 79.2 | 85.4 | 6.2 | 82.30 | 0.30 | 79.8 | 85.4 | 5.6 | 82.60 | 0.65 |
| 30 | Gard | 78.9 | 85.1 | 6.2 | 82.00 | 0.45 | 79.6 | 85.3 | 5.7 | 82.45 | 0.10 | 79.9 | 85.2 | 5.3 | 82.55 | 0.55 |
| 68 | Haut-Rhin | 79.5 | 84.2 | 4.7 | 81.85 | 0.60 | 80.1 | 84.8 | 4.7 | 82.45 | 0.05 | 79.9 | 85.1 | 5.2 | 82.50 | 0.65 |
| 17 | Charente-Maritime | 78.2 | 85.4 | 7.2 | 81.80 | 0.40 | 79.2 | 85.2 | 6.0 | 82.20 | 0.30 | 79.5 | 85.5 | 6.0 | 82.50 | 0.70 |
| 19 | Corrèze | 78.5 | 84.9 | 6.4 | 81.70 | 0.10 | 78.7 | 84.9 | 6.2 | 81.80 | 0.65 | 80.1 | 84.8 | 4.7 | 82.45 | 0.75 |
| 07 | Ardèche | 79.1 | 84.8 | 5.7 | 81.95 | 0.65 | 79.9 | 85.3 | 5.4 | 82.60 | −0.15 | 79.8 | 85.1 | 5.3 | 82.45 | 0.50 |
| 63 | Puy-de-Dôme | 79.1 | 85.1 | 6.0 | 82.10 | 0.30 | 79.3 | 85.5 | 6.2 | 82.40 | 0.05 | 79.8 | 85.1 | 5.3 | 82.45 | 0.35 |
| 47 | Lot-et-Garonne | 79.0 | 85.2 | 6.2 | 82.10 | 0.15 | 79.3 | 85.2 | 5.9 | 82.25 | 0.15 | 79.7 | 85.1 | 5.4 | 82.40 | 0.30 |
| 71 | Saône-et-Loire | 78.1 | 85.1 | 7.0 | 81.60 | 0.45 | 79.1 | 85.0 | 5.9 | 82.05 | 0.30 | 79.4 | 85.3 | 5.9 | 82.35 | 0.75 |
| 65 | Hautes-Pyrénées | 78.3 | 85.3 | 7.0 | 81.80 | 0.55 | 80.1 | 84.6 | 4.5 | 82.35 | −0.05 | 79.5 | 85.1 | 5.6 | 82.30 | 0.50 |
| 56 | Morbihan | 78.1 | 84.7 | 6.6 | 81.40 | 0.25 | 78.1 | 85.2 | 7.1 | 81.65 | 0.65 | 79.5 | 85.1 | 5.6 | 82.30 | 0.90 |
| 41 | Loir-et-Cher | 79.6 | 85.1 | 5.5 | 82.35 | −0.20 | 79.3 | 85.0 | 5.7 | 82.15 | 0.15 | 79.2 | 85.4 | 6.2 | 82.30 | −0.05 |
| 43 | Haute-Loire | 78.5 | 84.5 | 6.0 | 81.50 | 0.90 | 79.2 | 85.6 | 6.4 | 82.40 | −0.15 | 79.2 | 85.3 | 6.1 | 82.25 | 0.75 |
| 86 | Vienne | 80.1 | 85.7 | 5.6 | 82.90 | −0.20 | 79.5 | 85.9 | 6.4 | 82.70 | −0.50 | 79.4 | 85.0 | 5.6 | 82.20 | −0.70 |
| 82 | Tarn-et-Garonne | 79.3 | 85.5 | 6.2 | 82.40 | 0.25 | 79.8 | 85.5 | 5.7 | 82.65 | −0.45 | 79.3 | 85.1 | 5.8 | 82.20 | −0.20 |
| 48 | Lozère | 78.9 | 83.5 | 4.6 | 81.20 | 0.75 | 78.7 | 85.2 | 6.5 | 81.95 | 0.25 | 78.6 | 85.8 | 7.2 | 82.20 | 1.00 |
| 25 | Doubs | 79.1 | 85.7 | 6.6 | 82.40 | 0.05 | 79.3 | 85.6 | 6.3 | 82.45 | −0.30 | 79.5 | 84.8 | 5.3 | 82.15 | −0.25 |
| 03 | Allier | 78.1 | 84.5 | 6.4 | 81.30 | −0.15 | 77.7 | 84.6 | 6.9 | 81.15 | 1.00 | 78.8 | 85.5 | 6.7 | 82.15 | 0.85 |
| 15 | Cantal | 78.8 | 84.2 | 5.4 | 81.50 | −0.15 | 78.4 | 84.3 | 5.9 | 81.35 | 0.75 | 79.5 | 84.7 | 5.2 | 82.10 | 0.60 |
| 87 | Haute-Vienne | 78.5 | 84.7 | 6.2 | 81.60 | 0.65 | 78.8 | 85.7 | 6.9 | 82.25 | −0.20 | 78.8 | 85.3 | 6.5 | 82.05 | 0.45 |
| 60 | Oise | 78.0 | 83.9 | 5.9 | 80.95 | 0.70 | 78.7 | 84.6 | 5.9 | 81.65 | 0.35 | 79.5 | 84.5 | 5.0 | 82.00 | 1.05 |
| 16 | Charente | 78.5 | 85.2 | 6.7 | 81.85 | 0.10 | 79.4 | 84.5 | 5.1 | 81.95 | 0.05 | 79.1 | 84.9 | 5.8 | 82.00 | 0.15 |
| 14 | Calvados | 78.1 | 85.0 | 6.9 | 81.55 | 0.20 | 78.5 | 85.0 | 6.5 | 81.75 | 0.25 | 79.1 | 84.9 | 5.8 | 82.00 | 0.45 |
| 50 | Manche | 78.1 | 85.1 | 7.0 | 81.60 | 0.50 | 78.6 | 85.6 | 7.0 | 82.10 | −0.10 | 78.9 | 85.1 | 6.2 | 82.00 | 0.40 |
| 79 | Deux-Sèvres | 79.6 | 85.5 | 5.9 | 82.55 | 0.20 | 79.6 | 85.9 | 6.3 | 82.75 | −0.80 | 79.4 | 84.5 | 5.1 | 81.95 | −0.60 |
| 54 | Meurthe-et-Moselle | 78.8 | 84.2 | 5.4 | 81.50 | 0.70 | 79.3 | 85.1 | 5.8 | 82.20 | −0.25 | 79.4 | 84.5 | 5.1 | 81.95 | 0.45 |
| 51 | Marne | 77.7 | 84.2 | 6.5 | 80.95 | 0.85 | 78.8 | 84.8 | 6.0 | 81.80 | 0.15 | 79.0 | 84.9 | 5.9 | 81.95 | 1.00 |
| 39 | Jura | 78.9 | 84.9 | 6.0 | 81.90 | 0.65 | 80.0 | 85.1 | 5.1 | 82.55 | −0.65 | 78.9 | 84.9 | 6.0 | 81.90 | 0.00 |
| 28 | Eure-et-Loir | 79.1 | 85.0 | 5.9 | 82.05 | 0.10 | 79.2 | 85.1 | 5.9 | 82.15 | −0.30 | 78.9 | 84.8 | 5.9 | 81.85 | −0.20 |
| 24 | Dordogne | 78.7 | 84.9 | 6.2 | 81.80 | 0.40 | 79.4 | 85.0 | 5.6 | 82.20 | −0.45 | 78.7 | 84.8 | 6.1 | 81.75 | −0.05 |
| 66 | Pyrénées-Orientales | 78.1 | 84.6 | 6.5 | 81.35 | 0.45 | 78.7 | 84.9 | 6.2 | 81.80 | −0.05 | 78.6 | 84.9 | 6.3 | 81.75 | 0.40 |
| 29 | Finistère | 77.2 | 84.4 | 7.2 | 80.80 | 0.70 | 78.2 | 84.8 | 6.6 | 81.50 | 0.15 | 78.7 | 84.6 | 5.9 | 81.65 | 0.85 |
| 11 | Aude | 78.7 | 85.2 | 6.5 | 81.95 | 0.30 | 79.4 | 85.1 | 5.7 | 82.25 | −0.60 | 78.5 | 84.8 | 6.3 | 81.65 | −0.30 |
| 76 | Seine-Maritime | 77.3 | 84.2 | 6.9 | 80.75 | 0.60 | 78.1 | 84.6 | 6.5 | 81.35 | 0.25 | 78.8 | 84.4 | 5.6 | 81.60 | 0.85 |
| 61 | Orne | 78.3 | 85.1 | 6.8 | 81.70 | −0.20 | 78.2 | 84.8 | 6.6 | 81.50 | 0.10 | 78.2 | 85.0 | 6.8 | 81.60 | −0.10 |
| 90 | Territoire de Belfort | 78.7 | 82.8 | 4.1 | 80.75 | 0.55 | 78.6 | 84.0 | 5.4 | 81.30 | 0.25 | 79.5 | 83.6 | 4.1 | 81.55 | 0.80 |
| 09 | Ariège | 79.3 | 84.9 | 5.6 | 82.10 | −0.25 | 78.7 | 85.0 | 6.3 | 81.85 | −0.30 | 78.6 | 84.5 | 5.9 | 81.55 | −0.55 |
| 89 | Yonne | 77.6 | 84.1 | 6.5 | 80.85 | −0.15 | 77.5 | 83.9 | 6.4 | 80.70 | 0.85 | 78.4 | 84.7 | 6.3 | 81.55 | 0.70 |
| 57 | Moselle | 78.3 | 83.7 | 5.4 | 81.00 | 0.40 | 78.9 | 83.9 | 5.0 | 81.40 | 0.10 | 78.7 | 84.3 | 5.6 | 81.50 | 0.50 |
| 27 | Eure | 77.7 | 84.4 | 6.7 | 81.05 | 0.40 | 78.3 | 84.6 | 6.3 | 81.45 | 0.05 | 78.4 | 84.6 | 6.2 | 81.50 | 0.45 |
| 59 | Nord | 76.8 | 83.2 | 6.4 | 80.00 | 0.70 | 77.6 | 83.8 | 6.2 | 80.70 | 0.70 | 78.4 | 84.4 | 6.0 | 81.40 | 1.40 |
| 70 | Haute-Saône | 78.2 | 84.5 | 6.3 | 81.35 | 0.20 | 78.7 | 84.4 | 5.7 | 81.55 | −0.15 | 78.2 | 84.6 | 6.4 | 81.40 | 0.05 |
| 10 | Aube | 78.6 | 84.1 | 5.5 | 81.35 | −0.25 | 77.6 | 84.6 | 7.0 | 81.10 | 0.30 | 78.2 | 84.6 | 6.4 | 81.40 | 0.05 |
| 36 | Indre | 77.3 | 84.0 | 6.7 | 80.65 | 0.65 | 77.7 | 84.9 | 7.2 | 81.30 | 0.05 | 78.2 | 84.5 | 6.3 | 81.35 | 0.70 |
| 55 | Meuse | 77.8 | 84.0 | 6.2 | 80.90 | 0.15 | 77.7 | 84.4 | 6.7 | 81.05 | 0.30 | 78.2 | 84.5 | 6.3 | 81.35 | 0.45 |
| 22 | Côtes-d'Armor | 77.7 | 84.8 | 7.1 | 81.25 | 0.05 | 78.1 | 84.5 | 6.4 | 81.30 | −0.15 | 78.0 | 84.3 | 6.3 | 81.15 | −0.10 |
| 88 | Vosges | 77.9 | 84.0 | 6.1 | 80.95 | 0.25 | 77.9 | 84.5 | 6.6 | 81.20 | −0.15 | 78.1 | 84.0 | 5.9 | 81.05 | 0.10 |
| 08 | Ardennes | 77.1 | 84.1 | 7.0 | 80.60 | 0.15 | 77.8 | 83.7 | 5.9 | 80.75 | 0.25 | 78.3 | 83.7 | 5.4 | 81.00 | 0.40 |
| 80 | Somme | 77.1 | 83.4 | 6.3 | 80.25 | 0.25 | 77.3 | 83.7 | 6.4 | 80.50 | 0.40 | 77.9 | 83.9 | 6.0 | 80.90 | 0.65 |
| 23 | Creuse | 77.6 | 84.6 | 7.0 | 81.10 | 0.10 | 77.3 | 85.1 | 7.8 | 81.20 | −0.35 | 77.4 | 84.3 | 6.9 | 80.85 | −0.25 |
| 18 | Cher | 78.0 | 84.2 | 6.2 | 81.10 | −0.45 | 78.0 | 83.3 | 5.3 | 80.65 | 0.15 | 77.7 | 83.9 | 6.2 | 80.80 | −0.30 |
| 52 | Haute-Marne | 77.8 | 83.1 | 5.3 | 80.45 | 0.35 | 77.1 | 84.5 | 7.4 | 80.80 | 0.00 | 77.0 | 84.6 | 7.6 | 80.80 | 0.35 |
| 58 | Nièvre | 77.1 | 84.1 | 7.0 | 80.60 | −0.10 | 77.1 | 83.9 | 6.8 | 80.50 | 0.25 | 77.1 | 84.4 | 7.3 | 80.75 | 0.15 |
| 02 | Aisne | 76.5 | 83.2 | 6.7 | 79.85 | 0.30 | 76.9 | 83.4 | 6.5 | 80.15 | 0.55 | 77.7 | 83.7 | 6.0 | 80.70 | 0.85 |
| 62 | Pas-de-Calais | 75.8 | 83.3 | 7.5 | 79.55 | 0.65 | 76.7 | 83.7 | 7.0 | 80.20 | 0.10 | 77.2 | 83.4 | 6.2 | 80.30 | 0.75 |
The table is compiled only for departments in metropolitan France. Data source: INSEE[6][7][8]


Eurostat (2014—2023)
By default the table is sorted by 2023.
| code | region | 2014 | 2014 →2019 |
2019 | 2019 →2023 |
2023 | 2014 →2023 | |||||||||
|---|---|---|---|---|---|---|---|---|---|---|---|---|---|---|---|---|
| overall | male | female | F Δ M | overall | male | female | F Δ M | overall | male | female | F Δ M | |||||
| France on average | 82.9 | 79.5 | 86.1 | 6.6 | 0.1 | 83.0 | 79.9 | 85.9 | 6.0 | 0.0 | 83.0 | 80.1 | 85.7 | 5.6 | 0.1 | |
| FR10 | Île-de-France (Paris Region) | 84.4 | 81.4 | 87.1 | 5.7 | 0.2 | 84.6 | 81.8 | 87.1 | 5.3 | 0.3 | 84.9 | 82.3 | 87.3 | 5.0 | 0.5 |
| FRK2 | Rhône-Alpes | 84.0 | 80.9 | 86.9 | 6.0 | 0.1 | 84.1 | 81.2 | 86.8 | 5.6 | 0.3 | 84.4 | 81.7 | 86.9 | 5.2 | 0.4 |
| FRM0 | Corsica | 83.2 | 80.4 | 86.1 | 5.7 | 0.8 | 84.0 | 81.5 | 86.5 | 5.0 | −0.1 | 83.9 | 81.7 | 85.9 | 4.2 | 0.7 |
| FRL0 | Provence-Alpes-Côte d'Azur | 83.4 | 80.1 | 86.4 | 6.3 | 0.0 | 83.4 | 80.5 | 86.2 | 5.7 | 0.3 | 83.7 | 80.8 | 86.3 | 5.5 | 0.3 |
| FRJ2 | Midi-Pyrénées | 83.7 | 80.5 | 86.7 | 6.2 | 0.1 | 83.8 | 81.0 | 86.4 | 5.4 | −0.2 | 83.6 | 81.1 | 86.1 | 5.0 | −0.1 |
| FRI1 | Aquitaine | 83.1 | 79.9 | 86.1 | 6.2 | 0.3 | 83.4 | 80.3 | 86.3 | 6.0 | 0.0 | 83.4 | 80.6 | 86.1 | 5.5 | 0.3 |
| FRG0 | Pays de la Loire | 83.5 | 79.9 | 86.9 | 7.0 | −0.1 | 83.4 | 80.1 | 86.6 | 6.5 | 0.0 | 83.4 | 80.4 | 86.4 | 6.0 | −0.1 |
| FRF1 | Alsace | 82.8 | 79.7 | 85.9 | 6.2 | 0.5 | 83.3 | 80.5 | 85.9 | 5.4 | −0.3 | 83.0 | 80.4 | 85.5 | 5.1 | 0.2 |
| FRJ1 | Languedoc-Roussillon | 82.8 | 79.5 | 86.0 | 6.5 | 0.3 | 83.1 | 80.1 | 86.0 | 5.9 | −0.4 | 82.7 | 79.7 | 85.6 | 5.9 | −0.1 |
| FRI3 | Poitou-Charentes | 83.2 | 79.7 | 86.5 | 6.8 | −0.4 | 82.8 | 79.6 | 85.9 | 6.3 | −0.2 | 82.6 | 79.7 | 85.4 | 5.7 | −0.6 |
| FRB0 | Centre-Val de Loire (Centre Region) | 82.9 | 79.4 | 86.3 | 6.9 | −0.2 | 82.7 | 79.6 | 85.7 | 6.1 | −0.1 | 82.6 | 79.6 | 85.5 | 5.9 | −0.3 |
| FRH0 | Brittany | 82.3 | 78.6 | 85.8 | 7.2 | 0.2 | 82.5 | 79.0 | 85.9 | 6.9 | 0.0 | 82.5 | 79.6 | 85.4 | 5.8 | 0.2 |
| FRK1 | Auvergne | 82.5 | 78.9 | 86.1 | 7.2 | 0.0 | 82.5 | 79.3 | 85.7 | 6.4 | −0.1 | 82.4 | 79.5 | 85.3 | 5.8 | −0.1 |
| FRC2 | Franche-Comté | 82.7 | 79.4 | 86.0 | 6.6 | 0.1 | 82.8 | 79.7 | 85.9 | 6.2 | −0.5 | 82.3 | 79.5 | 85.1 | 5.6 | −0.4 |
| FRI2 | Limousin | 82.7 | 79.0 | 86.4 | 7.4 | −0.4 | 82.3 | 78.9 | 85.7 | 6.8 | 0.0 | 82.3 | 79.3 | 85.3 | 6.0 | −0.4 |
| FRY4 | Réunion (in the Indian Ocean) | 81.0 | 77.3 | 84.4 | 7.1 | 0.3 | 81.3 | 77.5 | 85.0 | 7.5 | 1.0 | 82.3 | 79.3 | 85.2 | 5.9 | 1.3 |
| FRD1 | Lower Normandy | 82.4 | 78.8 | 85.9 | 7.1 | 0.1 | 82.5 | 79.0 | 85.8 | 6.8 | −0.2 | 82.3 | 79.1 | 85.4 | 6.3 | −0.1 |
| FRC1 | Burgundy | 82.4 | 78.8 | 85.9 | 7.1 | 0.0 | 82.4 | 79.3 | 85.6 | 6.3 | −0.2 | 82.2 | 79.2 | 85.3 | 6.1 | −0.2 |
| FRF3 | Lorraine | 81.9 | 78.6 | 85.1 | 6.5 | 0.1 | 82.0 | 79.0 | 84.9 | 5.9 | −0.1 | 81.9 | 79.1 | 84.7 | 5.6 | 0.0 |
| FRD2 | Upper Normandy | 81.5 | 77.9 | 84.9 | 7.0 | 0.3 | 81.8 | 78.5 | 85.0 | 6.5 | 0.1 | 81.9 | 78.9 | 84.9 | 6.0 | 0.4 |
| FRF2 | Champagne-Ardenne | 81.9 | 78.3 | 85.3 | 7.0 | −0.1 | 81.8 | 78.4 | 85.1 | 6.7 | 0.0 | 81.8 | 78.6 | 84.9 | 6.3 | −0.1 |
| FRY2 | Martinique (in the Caribbean) | 81.5 | 78.2 | 84.4 | 6.2 | 0.6 | 82.1 | 78.7 | 85.2 | 6.5 | −0.4 | 81.7 | 78.6 | 84.3 | 5.7 | 0.2 |
| FRE2 | Picardy | 81.1 | 77.7 | 84.4 | 6.7 | 0.3 | 81.4 | 78.3 | 84.5 | 6.2 | 0.0 | 81.4 | 78.5 | 84.3 | 5.8 | 0.3 |
| FRE1 | Nord-Pas-de-Calais | 80.6 | 76.8 | 84.2 | 7.4 | 0.5 | 81.1 | 77.6 | 84.4 | 6.8 | 0.1 | 81.2 | 77.9 | 84.3 | 6.4 | 0.6 |
| FRY1 | Guadeloupe (incl. Saint Martin, in the Caribbean) | 80.6 | 76.4 | 84.6 | 8.2 | 1.2 | 81.8 | 77.8 | 85.5 | 7.7 | −1.2 | 80.6 | 76.6 | 84.1 | 7.5 | 0.0 |
| FRY3 | French Guiana (in South America) | — | — | — | — | — | — | — | — | — | — | 79.3 | 76.1 | 82.5 | 6.4 | — |
| FRY5 | Mayotte (in the Indian Ocean) | 77.0 | 75.4 | 78.7 | 3.3 | −1.1 | 75.9 | 75.5 | 76.3 | 0.8 | −1.0 | 74.9 | 73.5 | 76.2 | 2.7 | −2.1 |
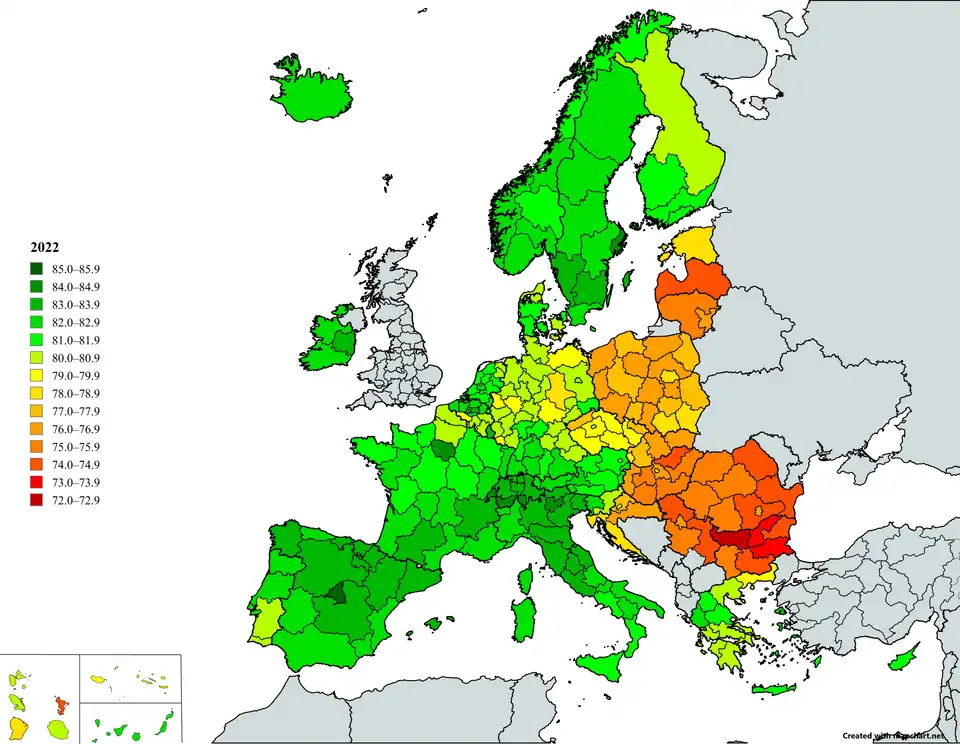
Global Data Lab (2019–2022)
| region | 2019 | 2019 →2021 |
2021 | 2021 →2022 |
2022 | 2019 →2022 | ||||||
|---|---|---|---|---|---|---|---|---|---|---|---|---|
| overall | male | female | F Δ M | overall | overall | male | female | F Δ M | ||||
| France on average | 82.73 | 79.72 | 85.61 | 5.89 | −0.23 | 82.50 | 0.73 | 83.23 | 80.36 | 85.97 | 5.61 | 0.50 |
| Île-de-France (Paris Region) | 84.21 | 81.46 | 86.68 | 5.22 | −0.41 | 83.80 | 1.11 | 84.91 | 82.29 | 87.31 | 5.02 | 0.70 |
| Rhône-Alpes | 83.71 | 80.87 | 86.38 | 5.51 | 0.09 | 83.80 | 0.71 | 84.51 | 81.68 | 87.11 | 5.43 | 0.80 |
| Midi-Pyrénées | 83.41 | 80.67 | 85.98 | 5.31 | 0.09 | 83.50 | 0.30 | 83.80 | 81.27 | 86.40 | 5.13 | 0.39 |
| Corsica (in the Mediterranean Sea) | 83.61 | 81.17 | 86.08 | 4.91 | −0.21 | 83.40 | 0.30 | 83.70 | 81.07 | 86.20 | 5.13 | 0.09 |
| Provence-Alpes-Côte d'Azur | 83.01 | 80.17 | 85.78 | 5.61 | −0.61 | 82.40 | 1.20 | 83.60 | 80.77 | 86.20 | 5.43 | 0.59 |
| Pays de la Loire | 83.01 | 79.77 | 86.18 | 6.41 | 0.09 | 83.10 | 0.40 | 83.50 | 80.36 | 86.40 | 6.04 | 0.49 |
| Aquitaine | 83.01 | 79.97 | 85.88 | 5.91 | 0.09 | 83.10 | 0.30 | 83.40 | 80.77 | 85.90 | 5.13 | 0.39 |
| Alsace | 82.91 | 80.17 | 85.49 | 5.32 | −0.01 | 82.90 | 0.19 | 83.09 | 80.57 | 85.49 | 4.92 | 0.18 |
| Franche-Comté | 82.42 | 79.37 | 85.49 | 6.12 | −0.02 | 82.40 | 0.49 | 82.89 | 80.06 | 85.70 | 5.64 | 0.47 |
| Languedoc-Roussillon | 82.72 | 79.77 | 85.59 | 5.82 | −0.42 | 82.30 | 0.59 | 82.89 | 79.96 | 85.70 | 5.74 | 0.17 |
| Auvergne | 82.12 | 78.97 | 85.29 | 6.32 | −0.02 | 82.10 | 0.69 | 82.79 | 79.76 | 85.70 | 5.94 | 0.67 |
| Limousin | 81.92 | 78.58 | 85.29 | 6.71 | 0.18 | 82.10 | 0.69 | 82.79 | 79.76 | 85.70 | 5.94 | 0.87 |
| Centre-Val de Loire (Centre Region) | 82.32 | 79.27 | 85.29 | 6.02 | −0.12 | 82.20 | 0.49 | 82.69 | 79.86 | 85.59 | 5.73 | 0.37 |
| Brittany | 82.12 | 78.68 | 85.49 | 6.81 | 0.28 | 82.40 | 0.29 | 82.69 | 79.56 | 85.80 | 6.24 | 0.57 |
| Poitou-Charentes | 82.42 | 79.27 | 85.49 | 6.22 | −0.12 | 82.30 | 0.39 | 82.69 | 79.35 | 85.90 | 6.55 | 0.27 |
| Burgundy | 82.02 | 78.97 | 85.19 | 6.22 | 0.28 | 82.30 | 0.19 | 82.49 | 79.46 | 85.49 | 6.03 | 0.47 |
| Champagne-Ardenne | 81.42 | 78.08 | 84.69 | 6.61 | −0.22 | 81.20 | 0.99 | 82.19 | 79.05 | 85.29 | 6.24 | 0.77 |
| Lower Normandy | 82.12 | 78.68 | 85.39 | 6.71 | −0.42 | 81.70 | 0.38 | 82.08 | 78.95 | 85.29 | 6.34 | −0.04 |
| Lorraine | 81.62 | 78.68 | 84.49 | 5.81 | −0.32 | 81.30 | 0.68 | 81.98 | 79.25 | 84.69 | 5.44 | 0.36 |
| Upper Normandy | 81.42 | 78.18 | 84.59 | 6.41 | −0.02 | 81.40 | 0.38 | 81.78 | 78.75 | 84.69 | 5.94 | 0.36 |
| Picardy | 81.02 | 77.98 | 84.09 | 6.11 | −0.32 | 80.70 | 0.98 | 81.68 | 78.65 | 84.59 | 5.94 | 0.66 |
| Nord-Pas-de-Calais | 80.72 | 77.28 | 83.99 | 6.71 | −0.32 | 80.40 | 0.88 | 81.28 | 77.94 | 84.49 | 6.55 | 0.56 |
| Guadeloupe (in the Caribbean) | 81.42 | 77.48 | 85.09 | 7.61 | −3.82 | 77.60 | 3.37 | 80.97 | 76.93 | 84.69 | 7.76 | −0.45 |
| Martinique (in the Caribbean) | 81.72 | 78.38 | 84.79 | 6.41 | −3.52 | 78.20 | 2.57 | 80.77 | 77.84 | 83.48 | 5.64 | −0.95 |
| Réunion (in the Indian Ocean) | 80.92 | 77.18 | 84.59 | 7.41 | −0.02 | 80.90 | −0.13 | 80.77 | 77.64 | 83.78 | 6.14 | −0.15 |
| French Guiana (in South America) | 78.14 | 75.04 | 81.36 | 6.32 | −0.94 | 77.20 | 2.16 | 79.36 | 76.12 | 82.67 | 6.55 | 1.22 |
| Mayotte (in the Indian Ocean) | 75.55 | 75.19 | 75.93 | 0.74 | −4.05 | 71.50 | 3.52 | 75.02 | 74.81 | 75.01 | 0.20 | −0.53 |
Data source: Global Data Lab[11]
Charts
-
![Development of life expectancy in France according to estimation of the World Bank Group[2]](./_assets_/Life_expectancy_by_WBG_-France.png) Development of life expectancy in France according to estimation of the World Bank Group[2]
Development of life expectancy in France according to estimation of the World Bank Group[2] -
![Life expectancy with calculated sex gap[2]](./_assets_/Life_expectancy_by_WBG_-France_-diff.png) Life expectancy with calculated sex gap[2]
Life expectancy with calculated sex gap[2] -
![Life expectancy in comparison to presidents of the country[2]](./_assets_/Life_expectancy_by_WBG_-France_-leader.png) Life expectancy in comparison to presidents of the country[2]
Life expectancy in comparison to presidents of the country[2] -
![Life expectancy in France according to estimation of Our World in Data[12]](./_assets_/Life-expectancy%252C_1816_to_2023%252C_FRA.svg.png) Life expectancy in France according to estimation of Our World in Data[12]
Life expectancy in France according to estimation of Our World in Data[12] -
![Development of life expectancy in France in comparison to some big countries of the world[2]](./_assets_/Life_expectancy_in_some_big_countries.png) Development of life expectancy in France in comparison to some big countries of the world[2]
Development of life expectancy in France in comparison to some big countries of the world[2] -
![Development of life expectancy in France in comparison to the largest by population European countries[2]](./_assets_/Life_expectancy_in_the_largest_European_countries.png) Development of life expectancy in France in comparison to the largest by population European countries[2]
Development of life expectancy in France in comparison to the largest by population European countries[2]
-
![Life expectancy and healthy life expectancy in France on the background of other countries of the world in 2019[5]](./_assets_/Healthy_life_expectancy_bar_chart_-world.png) Life expectancy and healthy life expectancy in France on the background of other countries of the world in 2019[5]
Life expectancy and healthy life expectancy in France on the background of other countries of the world in 2019[5] -
![Life expectancy and healthy life expectancy for males and females separately[5]](./_assets_/Healthy_life_expectancy_bar_chart_-world_-sex.png) Life expectancy and healthy life expectancy for males and females separately[5]
Life expectancy and healthy life expectancy for males and females separately[5]
-
![Life expectancy and healthy life expectancy in France on the background of other countries of Europe in 2019[5]](./_assets_/Healthy_life_expectancy_bar_chart_-Europe.png) Life expectancy and healthy life expectancy in France on the background of other countries of Europe in 2019[5]
Life expectancy and healthy life expectancy in France on the background of other countries of Europe in 2019[5] -
![Life expectancy and healthy life expectancy for males and females separately[5]](./_assets_/Healthy_life_expectancy_bar_chart_-Europe_-sex.png) Life expectancy and healthy life expectancy for males and females separately[5]
Life expectancy and healthy life expectancy for males and females separately[5]
See also
- List of countries by life expectancy
- List of European countries by life expectancy
- Demographics of France
- French paradox
References
- ^ "World Population Prospects 2024" (XLSX). United Nations Department of Economic and Social Affairs. 27 July 2024. — see file "Compact (most used: estimates and medium projections)"
- ^ a b c d e f "Life expectancy at birth, total - France". World Bank Group.
- ^ "Life expectancy at birth by sex". Eurostat. 5 June 2025. Retrieved 24 June 2025. — Dataset
- ^ "Life expectancy at birth by sex". Eurostat. 5 June 2025. Retrieved 24 June 2025. — Table. For visualization use the tab "Map"
- ^ a b c d e "Life expectancy and Healthy life expectancy, data by country". World Health Organization. 2020. Retrieved 1 February 2024.
- ^ a b c d e f "Espérance de vie en 2015: Comparaisons régionales et départementales" [Life expectancy in 2015: comparison of regions and departments]. National Institute of Statistics and Economic Studies (France) (in French). Archived from the original on 2017-08-27. Retrieved 2017-08-27.
- ^ a b c d e f "Espérance de vie en 2019: Comparaisons régionales et départementales" [Life expectancy in 2019: comparison of regions and departments]. National Institute of Statistics and Economic Studies (France) (in French). Archived from the original on 2021-04-12. Retrieved 2024-03-29.
- ^ a b c d e f "Espérance de vie en 2024: Comparaisons régionales et départementales" [Life expectancy in 2024: comparison of regions and departments]. National Institute of Statistics and Economic Studies (France) (in French). Retrieved 2025-05-23.
- ^ a b "Life expectancy at birth by sex and NUTS 2 region". Eurostat. 21 March 2025. Retrieved 1 May 2025. — Dataset
- ^ a b "Life expectancy at birth by sex and NUTS 2 region". Eurostat. 21 March 2025. Retrieved 1 May 2025. — Table. For visualization use tab "Map"
- ^ "Life expectancy 2022 - Maps | Subnational HDI (v8.0)". Global Data Lab. Retrieved 15 October 2024.
- ^ "Life expectancy at birth: France". Our World in Data.