Lambunao
Lambunao | |
|---|---|
| Municipality of Lambunao | |
 Flag | |
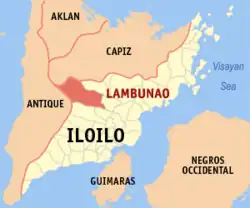 Map of Iloilo with Lambunao highlighted | |
OpenStreetMap | |
.svg.png) Lambunao Location within the Philippines | |
| Coordinates: 11°03′N 122°29′E / 11.05°N 122.48°E | |
| Country | Philippines |
| Region | Western Visayas |
| Province | Iloilo |
| District | 3rd district |
| Barangays | 73 (see Barangays) |
| Government | |
| • Type | Sangguniang Bayan |
| • Mayor | Reynor R. Gonzales(PFP) |
| • Vice Mayor | Arvin L. Losaria(PFP) |
| • Representative | Lorenz R. Defensor (NUP) |
| • Municipal Council | Members |
| • Electorate | 43,548 voters (2025) |
| Area | |
• Total | 407.09 km2 (157.18 sq mi) |
| Elevation | 112 m (367 ft) |
| Highest elevation | 281 m (922 ft) |
| Lowest elevation | 62 m (203 ft) |
| Population (2024 census)[3] | |
• Total | 80,724 |
| • Density | 200/km2 (510/sq mi) |
| • Households | 19,212 |
| Economy | |
| • Income class | 1st municipal income class |
| • Poverty incidence | 24.82 |
| • Revenue | ₱ 362.4 million (2022) |
| • Assets | ₱ 749.5 million (2022) |
| • Expenditure | ₱ 254.9 million (2022) |
| • Liabilities | ₱ 263.5 million (2022) |
| Service provider | |
| • Electricity | Iloilo 2 Electric Cooperative (ILECO 2) |
| Time zone | UTC+8 (PST) |
| ZIP code | 5042 |
| PSGC | |
| IDD : area code | +63 (0)33 |
| Native languages | Sulod Karay-a Hiligaynon Capisnon Tagalog |
| Website | www |
Lambunao, officially the Municipality of Lambunao (Kinaray-a: Banwa kang Lambunao, Hiligaynon: Banwa sang Lambunao, Tagalog: Bayan ng Lambunao), is a municipality in the province of Iloilo, Philippines. According to the 2020 census, it has a population of 81,236 people.[5]
Lambunao is the largest municipality in Iloilo in terms of land area and is 47 kilometres (29 mi) from Iloilo City.
Geography
Barangays
Lambunao is politically subdivided into 73 barangays. [6] Each barangay consists of puroks and some have sitios.
- Agsirab
- Agtuman
- Alugmawa
- Badiangan
- Bagongbong
- Balagiao
- Banban
- Bansag
- Bayuco
- Binaba-an Armada
- Binaba-an Labayno
- Binaba-an Limoso
- Binaba-an Portigo
- Binaba-an Tirador
- Bonbon
- Bontoc
- Buri
- Burirao
- Buwang
- Cabatangan
- Cabugao
- Cabunlawan
- Caguisanan
- Caloy-ahan
- Caninguan
- Capangyan
- Cayan Este
- Cayan Oeste
- Corot-on
- Coto
- Cubay
- Cunarum
- Daanbanwa
- Gines
- Hipgos
- Jayubo
- Jorog
- Lanot Grande
- Lanot Pequeño
- Legayada
- Lumanay (Daanbanwa I)
- Madarag
- Magbato
- Maite Grande
- Maite Pequeño
- Malag-it
- Manaulan
- Maribong
- Marong
- Misi
- Natividad
- Pajo
- Pandan
- Panuran
- Pasig
- Patag
- Poblacion Ilawod
- Poblacion Ilaya
- Poong
- Pughanan
- Pungsod
- Quiling
- Sagcup
- San Gregorio
- Sibacungan
- Sibaguan
- Simsiman
- Supoc
- Tampucao
- Tranghawan
- Tubungan
- Tuburan
- Walang
Climate
The municipality was in the path of Typhoon Haiyan, which caused landslides and damaged agricultural areas.[7]
| Climate data for Lambunao, Iloilo | |||||||||||||
|---|---|---|---|---|---|---|---|---|---|---|---|---|---|
| Month | Jan | Feb | Mar | Apr | May | Jun | Jul | Aug | Sep | Oct | Nov | Dec | Year |
| Mean daily maximum °C (°F) | 29 (84) |
30 (86) |
32 (90) |
33 (91) |
31 (88) |
30 (86) |
29 (84) |
29 (84) |
29 (84) |
29 (84) |
29 (84) |
29 (84) |
30 (86) |
| Mean daily minimum °C (°F) | 22 (72) |
22 (72) |
22 (72) |
23 (73) |
25 (77) |
25 (77) |
24 (75) |
24 (75) |
24 (75) |
24 (75) |
23 (73) |
22 (72) |
23 (74) |
| Average precipitation mm (inches) | 48 (1.9) |
41 (1.6) |
58 (2.3) |
82 (3.2) |
223 (8.8) |
300 (11.8) |
346 (13.6) |
307 (12.1) |
311 (12.2) |
292 (11.5) |
167 (6.6) |
81 (3.2) |
2,256 (88.8) |
| Average rainy days | 11.4 | 7.7 | 11.3 | 15.4 | 25.7 | 28.5 | 29.5 | 28.7 | 28.3 | 28.7 | 21.8 | 15.2 | 252.2 |
| Source: Meteoblue[8] | |||||||||||||
Demographics
| Year | Pop. | ±% p.a. |
|---|---|---|
| 1903 | 6,661 | — |
| 1918 | 13,120 | +4.62% |
| 1939 | 23,249 | +2.76% |
| 1948 | 26,099 | +1.29% |
| 1960 | 31,504 | +1.58% |
| 1970 | 36,630 | +1.52% |
| 1975 | 42,537 | +3.04% |
| 1980 | 45,435 | +1.33% |
| 1990 | 55,325 | +1.99% |
| 1995 | 58,792 | +1.15% |
| 2000 | 61,084 | +0.82% |
| 2007 | 63,300 | +0.49% |
| 2010 | 69,023 | +3.20% |
| 2015 | 73,640 | +1.24% |
| 2020 | 81,236 | +2.09% |
| 2024 | 80,724 | −0.15% |
| Source: Philippine Statistics Authority[9][10][11][12][13] | ||
In the 2020 census, the population of Lambunao was 81,236 people,[14] with a density of 200 inhabitants per square kilometre or 520 inhabitants per square mile.
Economy
Poverty incidence of Lambunao
10
20
30
40
50
60
2000
53.82 2003
43.15 2006
40.70 2009
23.18 2012
26.61 2015
26.33 2018
21.98 2021
24.82 Source: Philippine Statistics Authority[15][16][17][18][19][20][21][22] |
References
- ^ Municipality of Lambunao | (DILG)
- ^ "2015 Census of Population, Report No. 3 – Population, Land Area, and Population Density" (PDF). Philippine Statistics Authority. Quezon City, Philippines. August 2016. ISSN 0117-1453. Archived (PDF) from the original on May 25, 2021. Retrieved July 16, 2021.
- ^ "2024 Census of Population (POPCEN) Population Counts Declared Official by the President". Philippine Statistics Authority. 17 July 2025. Retrieved 18 July 2025.
- ^ "PSA Releases the 2021 City and Municipal Level Poverty Estimates". Philippine Statistics Authority. 2 April 2024. Retrieved 28 April 2024.
- ^ "2024 Census of Population (POPCEN) Population Counts Declared Official by the President". Philippine Statistics Authority. 17 July 2025. Retrieved 18 July 2025.
- ^ "Province: Iloilo". PSGC Interactive. Quezon City, Philippines: Philippine Statistics Authority. Retrieved 12 November 2016.
- ^ Keith Anthony S. Fabro (4 August 2023). "In Philippines, climate change tests Indigenous farming like never before". Mongabay. Retrieved 11 August 2023.
- ^ "Lambunao: Average Temperatures and Rainfall". Meteoblue. Retrieved 3 May 2020.
- ^ "2024 Census of Population (POPCEN) Population Counts Declared Official by the President". Philippine Statistics Authority. 17 July 2025. Retrieved 18 July 2025.
- ^ Census of Population (2015). "Region VI (Western Visayas)". Total Population by Province, City, Municipality and Barangay. Philippine Statistics Authority. Retrieved 20 June 2016.
- ^ Census of Population and Housing (2010). "Region VI (Western Visayas)" (PDF). Total Population by Province, City, Municipality and Barangay. National Statistics Office. Retrieved 29 June 2016.
- ^ Censuses of Population (1903–2007). "Region VI (Western Visayas)". Table 1. Population Enumerated in Various Censuses by Province/Highly Urbanized City: 1903 to 2007. National Statistics Office.
- ^ "Province of Iloilo". Municipality Population Data. Local Water Utilities Administration Research Division. Retrieved 17 December 2016.
- ^ "2024 Census of Population (POPCEN) Population Counts Declared Official by the President". Philippine Statistics Authority. 17 July 2025. Retrieved 18 July 2025.
- ^ "Poverty incidence (PI):". Philippine Statistics Authority. Retrieved December 28, 2020.
- ^ "Estimation of Local Poverty in the Philippines" (PDF). Philippine Statistics Authority. 29 November 2005.
- ^ "2003 City and Municipal Level Poverty Estimates" (PDF). Philippine Statistics Authority. 23 March 2009.
- ^ "City and Municipal Level Poverty Estimates; 2006 and 2009" (PDF). Philippine Statistics Authority. 3 August 2012.
- ^ "2012 Municipal and City Level Poverty Estimates" (PDF). Philippine Statistics Authority. 31 May 2016.
- ^ "Municipal and City Level Small Area Poverty Estimates; 2009, 2012 and 2015". Philippine Statistics Authority. 10 July 2019.
- ^ "PSA Releases the 2018 Municipal and City Level Poverty Estimates". Philippine Statistics Authority. 15 December 2021. Retrieved 22 January 2022.
- ^ "PSA Releases the 2021 City and Municipal Level Poverty Estimates". Philippine Statistics Authority. 2 April 2024. Retrieved 28 April 2024.
External links
- Official Website of the Municipality of Lambunao
- Philippine Standard Geographic Code
- Philippine Census Information
- Local Governance Performance Management System Archived 2012-05-09 at the Wayback Machine
Places adjacent to Lambunao | ||||||||||||||||
|---|---|---|---|---|---|---|---|---|---|---|---|---|---|---|---|---|
| ||||||||||||||||
Iloilo City (capital and largest city) | |
| Municipalities |
|
| Component city | |
| Highly urbanized city |
|