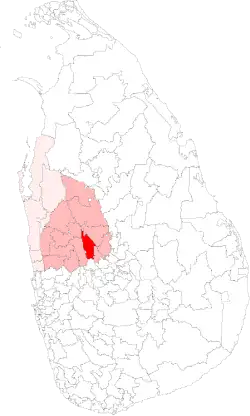
The Kurunegala Polling Division is a Polling Division in the Kurunegala Electoral District, in the North Western Province, Sri Lanka.
Presidential Election Results
Summary
The winner of Kurunegala has matched the final country result 7 out of 8 times. Hence, Kurunegala is a Strong Bellwether for Presidential Elections.
| Party
|
Kurunegala[4]
|
Kurunegala Electoral District
|
Sri Lanka
|
| Votes
|
%
|
Votes
|
%
|
Votes
|
%
|
|
|
SLPP
|
|
41,940
|
55.68%
|
|
652,278
|
57.90%
|
|
6,924,255
|
52.25%
|
|
|
NDF
|
|
29,021
|
38.53%
|
|
416,961
|
37.01%
|
|
5,564,239
|
41.99%
|
|
|
NMPP
|
|
3,030
|
4.02%
|
|
36,178
|
3.21%
|
|
418,553
|
3.16%
|
|
|
Other Parties (with < 1%)
|
|
1,332
|
1.77%
|
|
21,193
|
1.88%
|
|
345,452
|
2.61%
|
| Valid Votes
|
75,323
|
99.18%
|
1,126,610
|
99.25%
|
13,252,499
|
98.99%
|
| Rejected Votes
|
621
|
0.82%
|
8,522
|
0.75%
|
135,452
|
1.01%
|
| Total Polled
|
75,944
|
83.73%
|
1,135,132
|
85.24%
|
13,387,951
|
83.71%
|
| Registered Electors
|
90,702
|
|
1,331,705
|
|
15,992,568
|
|
| Party
|
Kurunegala[5]
|
Kurunegala Electoral District
|
Sri Lanka
|
| Votes
|
%
|
Votes
|
%
|
Votes
|
%
|
|
|
NDF
|
|
37,895
|
54.28%
|
|
476,602
|
45.76%
|
|
6,217,162
|
51.28%
|
|
|
UPFA
|
|
31,429
|
45.02%
|
|
556,868
|
53.46%
|
|
5,768,090
|
47.58%
|
|
|
Other Parties (with < 1%)
|
|
491
|
0.70%
|
|
8,154
|
0.78%
|
|
138,200
|
1.14%
|
| Valid Votes
|
69,815
|
99.17%
|
1,041,624
|
99.12%
|
12,123,452
|
98.85%
|
| Rejected Votes
|
583
|
0.83%
|
9,285
|
0.88%
|
140,925
|
1.15%
|
| Total Polled
|
70,398
|
78.80%
|
1,050,909
|
78.82%
|
12,264,377
|
78.69%
|
| Registered Electors
|
89,332
|
|
1,333,377
|
|
15,585,942
|
|
| Party
|
Kurunegala[6]
|
Kurunegala Electoral District
|
Sri Lanka
|
| Votes
|
%
|
Votes
|
%
|
Votes
|
%
|
|
|
UPFA
|
|
34,912
|
57.31%
|
|
582,784
|
63.08%
|
|
6,015,934
|
57.88%
|
|
|
NDF
|
|
25,113
|
41.22%
|
|
327,594
|
35.46%
|
|
4,173,185
|
40.15%
|
|
|
Other Parties (with < 1%)
|
|
897
|
1.47%
|
|
13,515
|
1.46%
|
|
204,494
|
1.97%
|
| Valid Votes
|
60,922
|
99.20%
|
923,893
|
99.29%
|
10,393,613
|
99.03%
|
| Rejected Votes
|
492
|
0.80%
|
6,644
|
0.71%
|
101,838
|
0.97%
|
| Total Polled
|
61,414
|
75.33%
|
930,537
|
75.59%
|
10,495,451
|
66.70%
|
| Registered Electors
|
81,523
|
|
1,230,966
|
|
15,734,587
|
|
| Party
|
Kurunegala[7]
|
Kurunegala Electoral District
|
Sri Lanka
|
| Votes
|
%
|
Votes
|
%
|
Votes
|
%
|
|
|
UNP
|
|
29,564
|
50.20%
|
|
418,809
|
46.72%
|
|
4,706,366
|
48.43%
|
|
|
UPFA
|
|
28,791
|
48.88%
|
|
468,507
|
52.26%
|
|
4,887,152
|
50.29%
|
|
|
Other Parties (with < 1%)
|
|
541
|
0.92%
|
|
9,181
|
1.02%
|
|
123,521
|
1.27%
|
| Valid Votes
|
58,896
|
98.95%
|
896,497
|
99.07%
|
9,717,039
|
98.88%
|
| Rejected Votes
|
625
|
1.05%
|
8,458
|
0.93%
|
109,869
|
1.12%
|
| Total Polled
|
59,521
|
77.30%
|
904,955
|
77.87%
|
9,826,908
|
69.51%
|
| Registered Electors
|
77,003
|
|
1,162,099
|
|
14,136,979
|
|
| Party
|
Kurunegala[8]
|
Kurunegala Electoral District
|
Sri Lanka
|
| Votes
|
%
|
Votes
|
%
|
Votes
|
%
|
|
|
PA
|
|
23,715
|
48.48%
|
|
377,483
|
50.77%
|
|
4,312,157
|
51.12%
|
|
|
UNP
|
|
22,450
|
45.90%
|
|
326,327
|
43.89%
|
|
3,602,748
|
42.71%
|
|
|
JVP
|
|
1,700
|
3.48%
|
|
27,354
|
3.68%
|
|
343,927
|
4.08%
|
|
|
Other Parties (with < 1%)
|
|
1,049
|
2.14%
|
|
12,355
|
1.66%
|
|
176,679
|
2.09%
|
| Valid Votes
|
48,914
|
97.80%
|
743,519
|
97.99%
|
8,435,754
|
97.69%
|
| Rejected Votes
|
1,101
|
2.20%
|
15,272
|
2.01%
|
199,536
|
2.31%
|
| Total Polled
|
50,015
|
75.39%
|
758,791
|
75.83%
|
8,635,290
|
72.17%
|
| Registered Electors
|
66,346
|
|
1,000,624
|
|
11,965,536
|
|
| Party
|
Kurunegala[9]
|
Kurunegala Electoral District
|
Sri Lanka
|
| Votes
|
%
|
Votes
|
%
|
Votes
|
%
|
|
|
PA
|
|
24,685
|
58.39%
|
|
403,838
|
59.36%
|
|
4,709,205
|
62.28%
|
|
|
UNP
|
|
17,005
|
40.22%
|
|
266,740
|
39.21%
|
|
2,715,283
|
35.91%
|
|
|
Other Parties (with < 1%)
|
|
588
|
1.39%
|
|
9,766
|
1.44%
|
|
137,040
|
1.81%
|
| Valid Votes
|
42,278
|
98.41%
|
680,344
|
98.48%
|
7,561,526
|
98.03%
|
| Rejected Votes
|
682
|
1.59%
|
10,511
|
1.52%
|
151,706
|
1.97%
|
| Total Polled
|
42,960
|
72.63%
|
690,855
|
76.97%
|
7,713,232
|
69.12%
|
| Registered Electors
|
59,146
|
|
897,539
|
|
11,158,880
|
|
| Party
|
Kurunegala[10]
|
Kurunegala Electoral District
|
Sri Lanka
|
| Votes
|
%
|
Votes
|
%
|
Votes
|
%
|
|
|
UNP
|
|
13,598
|
52.32%
|
|
198,662
|
51.12%
|
|
2,569,199
|
50.43%
|
|
|
SLFP
|
|
11,851
|
45.60%
|
|
182,220
|
46.89%
|
|
2,289,857
|
44.95%
|
|
|
SLMP
|
|
541
|
2.08%
|
|
7,717
|
1.99%
|
|
235,701
|
4.63%
|
| Valid Votes
|
25,990
|
98.86%
|
388,599
|
98.91%
|
5,094,754
|
98.24%
|
| Rejected Votes
|
300
|
1.14%
|
4,281
|
1.09%
|
91,499
|
1.76%
|
| Total Polled
|
26,290
|
49.42%
|
392,880
|
53.49%
|
5,186,256
|
55.87%
|
| Registered Electors
|
53,193
|
|
734,453
|
|
9,283,143
|
|
| Party
|
Kurunegala[11]
|
Kurunegala Electoral District
|
Sri Lanka
|
| Votes
|
%
|
Votes
|
%
|
Votes
|
%
|
|
|
UNP
|
|
23,370
|
59.03%
|
|
345,769
|
55.77%
|
|
3,450,815
|
52.93%
|
|
|
SLFP
|
|
14,638
|
36.97%
|
|
248,479
|
40.08%
|
|
2,546,348
|
39.05%
|
|
|
JVP
|
|
1,300
|
3.28%
|
|
21,835
|
3.52%
|
|
273,428
|
4.19%
|
|
|
Other Parties (with < 1%)
|
|
285
|
0.72%
|
|
3,895
|
0.63%
|
|
249,460
|
3.83%
|
| Valid Votes
|
39,593
|
99.26%
|
619,978
|
99.13%
|
6,520,156
|
98.78%
|
| Rejected Votes
|
295
|
0.74%
|
5,431
|
0.87%
|
80,470
|
1.22%
|
| Total Polled
|
39,888
|
79.06%
|
625,409
|
86.00%
|
6,600,626
|
80.15%
|
| Registered Electors
|
50,454
|
|
727,202
|
|
8,235,358
|
|
Parliamentary Election Results
Summary
The winner of Kurunegala has matched the final country result 6 out of 7 times. Hence, Kurunegala is a Strong Bellwether for Parliamentary Elections.
| Party
|
Kurunegala[14]
|
Kurunegala Electoral District
|
Sri Lanka
|
| Votes
|
%
|
Votes
|
%
|
Votes
|
%
|
|
|
UNP
|
|
33,086
|
51.03%
|
|
441,275
|
45.87%
|
|
5,098,916
|
45.77%
|
|
|
UPFA
|
|
27,644
|
42.64%
|
|
474,124
|
49.29%
|
|
4,732,664
|
42.48%
|
|
|
JVP
|
|
3,738
|
5.77%
|
|
41,077
|
4.27%
|
|
544,154
|
4.88%
|
|
|
Other Parties (with < 1%)
|
|
364
|
0.56%
|
|
5,496
|
0.57%
|
|
83,041
|
0.75%
|
| Valid Votes
|
64,832
|
95.81%
|
961,972
|
95.39%
|
11,140,333
|
95.35%
|
| Rejected Votes
|
2,804
|
4.14%
|
46,036
|
4.56%
|
516,926
|
4.42%
|
| Total Polled
|
67,669
|
75.75%
|
1,008,459
|
79.63%
|
11,684,111
|
77.66%
|
| Registered Electors
|
89,332
|
|
1,266,443
|
|
15,044,490
|
|
| Party
|
Kurunegala[15]
|
Kurunegala Electoral District
|
Sri Lanka
|
| Votes
|
%
|
Votes
|
%
|
Votes
|
%
|
|
|
UPFA
|
|
27,030
|
58.75%
|
|
429,316
|
63.91%
|
|
4,846,388
|
60.38%
|
|
|
UNP
|
|
16,176
|
35.16%
|
|
213,713
|
31.81%
|
|
2,357,057
|
29.37%
|
|
|
DNA
|
|
2,649
|
5.76%
|
|
26,440
|
3.94%
|
|
441,251
|
5.50%
|
|
|
Other Parties (with < 1%)
|
|
153
|
0.33%
|
|
2,288
|
0.34%
|
|
34,779
|
0.43%
|
| Valid Votes
|
46,008
|
93.79%
|
671,757
|
92.58%
|
8,026,322
|
96.03%
|
| Rejected Votes
|
3,012
|
6.14%
|
53,130
|
7.32%
|
581,465
|
6.96%
|
| Total Polled
|
49,053
|
60.17%
|
725,566
|
59.08%
|
8,358,246
|
59.29%
|
| Registered Electors
|
81,523
|
|
1,228,044
|
|
14,097,690
|
|
| Party
|
Kurunegala[16]
|
Kurunegala Electoral District
|
Sri Lanka
|
| Votes
|
%
|
Votes
|
%
|
Votes
|
%
|
|
|
UPFA
|
|
23,472
|
44.87%
|
|
412,157
|
51.95%
|
|
4,223,126
|
45.70%
|
|
|
UNP
|
|
23,242
|
44.43%
|
|
340,768
|
42.95%
|
|
3,486,792
|
37.73%
|
|
|
JHU
|
|
5,347
|
10.22%
|
|
37,459
|
4.72%
|
|
552,723
|
5.98%
|
|
|
Other Parties (with < 1%)
|
|
248
|
0.47%
|
|
2,976
|
0.38%
|
|
64,640
|
0.70%
|
| Valid Votes
|
52,309
|
96.13%
|
793,360
|
95.14%
|
9,241,931
|
94.52%
|
| Rejected Votes
|
2,089
|
3.84%
|
40,261
|
4.83%
|
534,452
|
5.47%
|
| Total Polled
|
54,414
|
73.17%
|
833,908
|
76.54%
|
9,777,821
|
75.74%
|
| Registered Electors
|
74,368
|
|
1,089,482
|
|
12,909,631
|
|
| Party
|
Kurunegala[17]
|
Kurunegala Electoral District
|
Sri Lanka
|
| Votes
|
%
|
Votes
|
%
|
Votes
|
%
|
|
|
UNP
|
|
26,830
|
51.90%
|
|
382,768
|
48.59%
|
|
4,086,026
|
45.62%
|
|
|
PA
|
|
19,359
|
37.45%
|
|
332,775
|
42.24%
|
|
3,330,815
|
37.19%
|
|
|
JVP
|
|
4,656
|
9.01%
|
|
63,652
|
8.08%
|
|
815,353
|
9.10%
|
|
|
SU
|
|
520
|
1.01%
|
|
2,842
|
0.36%
|
|
50,665
|
0.57%
|
|
|
Other Parties (with < 1%)
|
|
328
|
0.63%
|
|
5,691
|
0.72%
|
|
83,105
|
0.93%
|
| Valid Votes
|
51,693
|
95.97%
|
787,728
|
95.35%
|
8,955,844
|
94.77%
|
| Rejected Votes
|
2,170
|
4.03%
|
38,451
|
4.65%
|
494,009
|
5.23%
|
| Total Polled
|
53,863
|
75.74%
|
826,179
|
78.98%
|
9,449,878
|
76.03%
|
| Registered Electors
|
71,111
|
|
1,046,102
|
|
12,428,762
|
|
| Party
|
Kurunegala[18]
|
Kurunegala Electoral District
|
Sri Lanka
|
| Votes
|
%
|
Votes
|
%
|
Votes
|
%
|
|
|
UNP
|
|
23,046
|
46.62%
|
|
308,106
|
41.86%
|
|
3,451,765
|
40.12%
|
|
|
PA
|
|
20,826
|
42.13%
|
|
358,794
|
48.75%
|
|
3,899,329
|
45.33%
|
|
|
JVP
|
|
3,054
|
6.18%
|
|
40,780
|
5.54%
|
|
518,725
|
6.03%
|
|
|
SU
|
|
1,144
|
2.31%
|
|
6,691
|
0.91%
|
|
127,859
|
1.49%
|
|
|
NUA
|
|
821
|
1.66%
|
|
11,927
|
1.62%
|
|
185,593
|
2.16%
|
|
|
Other Parties (with < 1%)
|
|
544
|
1.10%
|
|
9,730
|
1.32%
|
|
93,655
|
1.09%
|
| Valid Votes
|
49,435
|
N/A
|
736,028
|
N/A
|
8,602,617
|
N/A
|
| Party
|
Kurunegala[19]
|
Kurunegala Electoral District
|
Sri Lanka
|
| Votes
|
%
|
Votes
|
%
|
Votes
|
%
|
|
|
PA
|
|
22,173
|
49.52%
|
|
366,856
|
51.87%
|
|
3,887,805
|
48.94%
|
|
|
UNP
|
|
22,042
|
49.22%
|
|
332,547
|
47.02%
|
|
3,498,370
|
44.04%
|
|
|
Other Parties (with < 1%)
|
|
564
|
1.26%
|
|
7,876
|
1.11%
|
|
158,616
|
2.00%
|
| Valid Votes
|
44,779
|
95.83%
|
707,279
|
95.92%
|
7,943,688
|
95.20%
|
| Rejected Votes
|
1,947
|
4.17%
|
30,071
|
4.08%
|
400,395
|
4.80%
|
| Total Polled
|
46,726
|
79.00%
|
737,350
|
82.15%
|
8,344,095
|
74.75%
|
| Registered Electors
|
59,146
|
|
897,580
|
|
11,163,064
|
|
| Party
|
Kurunegala[20]
|
Kurunegala Electoral District
|
Sri Lanka
|
| Votes
|
%
|
Votes
|
%
|
Votes
|
%
|
|
|
UNP
|
|
21,692
|
61.24%
|
|
314,724
|
58.51%
|
|
2,838,005
|
50.71%
|
|
|
SLFP
|
|
11,849
|
33.45%
|
|
195,526
|
36.35%
|
|
1,785,369
|
31.90%
|
|
|
ELJP
|
|
1,086
|
3.07%
|
|
13,759
|
2.56%
|
|
67,723
|
1.21%
|
|
|
USA
|
|
508
|
1.43%
|
|
11,059
|
2.06%
|
|
141,983
|
2.54%
|
|
|
Other Parties (with < 1%)
|
|
284
|
0.80%
|
|
2,848
|
0.53%
|
|
90,480
|
1.62%
|
| Valid Votes
|
35,419
|
94.43%
|
537,916
|
94.02%
|
5,596,468
|
93.87%
|
| Rejected Votes
|
2,088
|
5.57%
|
34,212
|
5.98%
|
365,563
|
6.13%
|
| Total Polled
|
37,507
|
72.29%
|
572,128
|
72.88%
|
5,962,031
|
63.60%
|
| Registered Electors
|
51,885
|
|
784,991
|
|
9,374,164
|
|
Demographics
Ethnicity
The Kurunegala Polling Division has a Sinhalese majority (86.1%) and a significant Moor population (10.2%) . In comparison, the Kurunegala Electoral District (which contains the Kurunegala Polling Division) has a Sinhalese majority (91.4%) [1]
Religion
The Kurunegala Polling Division has a Buddhist majority (81.9%) and a significant Muslim population (10.9%) . In comparison, the Kurunegala Electoral District (which contains the Kurunegala Polling Division) has a Buddhist majority (88.5%) [1]
References