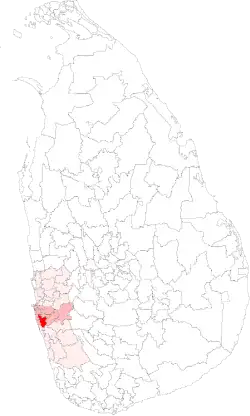
The Kesbewa Polling Division is a Polling Division in the Colombo Electoral District , in the Western Province, Sri Lanka .
Presidential Election Results
Summary
The winner of Kesbewa has matched the final country result 5 out of 8 times. Hence, Kesbewa is a Weak Bellwether for Presidential Elections.
Party
Kesbewa[ 4]
Colombo Electoral District
Sri Lanka
Votes
%
Votes
%
Votes
%
SLPP
99,062
67.68%
727,713
53.19%
6,924,255
52.25%
NDF
37,430
25.57%
559,921
40.92%
5,564,239
41.99%
NMPP
7,343
5.02%
53,803
3.93%
418,553
3.16%
Other Parties (with < 1%)
2,525
1.73%
26,740
1.95%
345,452
2.61%
Valid Votes
146,360
99.02%
1,368,177
98.89%
13,252,499
98.99%
Rejected Votes
1,444
0.98%
15,333
1.11%
135,452
1.01%
Total Polled
147,804
84.54%
1,383,510
82.82%
13,387,951
83.71%
Registered Electors
174,829
1,670,403
15,992,568
Party
Kesbewa[ 5]
Colombo Electoral District
Sri Lanka
Votes
%
Votes
%
Votes
%
UPFA
74,189
54.56%
562,614
43.40%
5,768,090
47.58%
NDF
61,116
44.94%
725,073
55.93%
6,217,162
51.28%
Other Parties (with < 1%)
678
0.50%
8,673
0.67%
138,200
1.14%
Valid Votes
135,983
98.99%
1,296,360
98.83%
12,123,452
98.85%
Rejected Votes
1,393
1.01%
15,334
1.17%
140,925
1.15%
Total Polled
137,376
83.37%
1,311,694
81.34%
12,264,377
78.69%
Registered Electors
164,774
1,612,660
15,585,942
Party
Kesbewa[ 6]
Colombo Electoral District
Sri Lanka
Votes
%
Votes
%
Votes
%
UPFA
77,474
65.10%
614,740
52.93%
6,015,934
57.88%
NDF
40,474
34.01%
533,022
45.90%
4,173,185
40.15%
Other Parties (with < 1%)
1,058
0.89%
13,620
1.17%
204,494
1.97%
Valid Votes
119,006
99.33%
1,161,382
99.03%
10,393,613
99.03%
Rejected Votes
803
0.67%
11,394
0.97%
101,838
0.97%
Total Polled
119,809
80.57%
1,172,776
76.09%
10,495,451
66.70%
Registered Electors
148,696
1,541,242
15,734,587
Party
Kesbewa[ 7]
Colombo Electoral District
Sri Lanka
Votes
%
Votes
%
Votes
%
UPFA
66,660
60.82%
534,431
47.96%
4,887,152
50.29%
UNP
42,042
38.36%
569,627
51.12%
4,706,366
48.43%
Other Parties (with < 1%)
900
0.82%
10,192
0.91%
123,521
1.27%
Valid Votes
109,602
99.00%
1,114,250
98.86%
9,717,039
98.88%
Rejected Votes
1,110
1.00%
12,879
1.14%
109,869
1.12%
Total Polled
110,712
79.03%
1,127,129
75.85%
9,826,908
69.51%
Registered Electors
140,094
1,486,021
14,136,979
Party
Kesbewa[ 8]
Colombo Electoral District
Sri Lanka
Votes
%
Votes
%
Votes
%
PA
51,240
57.17%
474,310
49.18%
4,312,157
51.12%
UNP
31,302
34.93%
425,185
44.08%
3,602,748
42.71%
JVP
5,236
5.84%
44,009
4.56%
343,927
4.08%
SMBP
940
1.05%
8,209
0.85%
35,854
0.43%
Other Parties (with < 1%)
905
1.01%
12,821
1.33%
140,825
1.67%
Valid Votes
89,623
96.80%
964,534
97.06%
8,435,754
97.69%
Rejected Votes
2,967
3.20%
29,197
2.94%
199,536
2.31%
Total Polled
92,590
76.00%
993,731
73.39%
8,635,290
72.17%
Registered Electors
121,836
1,354,025
11,965,536
Party
Kesbewa[ 9]
Colombo Electoral District
Sri Lanka
Votes
%
Votes
%
Votes
%
PA
54,327
70.03%
557,708
64.82%
4,709,205
62.28%
UNP
22,130
28.53%
288,741
33.56%
2,715,283
35.91%
Other Parties (with < 1%)
1,121
1.44%
13,937
1.62%
137,040
1.81%
Valid Votes
77,578
98.53%
860,386
98.17%
7,561,526
98.03%
Rejected Votes
1,159
1.47%
16,060
1.83%
151,706
1.97%
Total Polled
78,737
70.97%
876,446
69.59%
7,713,232
69.12%
Registered Electors
110,948
1,259,484
11,158,880
Party
Kesbewa[ 10]
Colombo Electoral District
Sri Lanka
Votes
%
Votes
%
Votes
%
SLFP
35,184
55.88%
339,958
46.23%
2,289,857
44.95%
UNP
25,549
40.58%
361,337
49.14%
2,569,199
50.43%
SLMP
2,228
3.54%
34,020
4.63%
235,701
4.63%
Valid Votes
62,961
98.62%
735,315
98.49%
5,094,754
98.24%
Rejected Votes
879
1.38%
11,295
1.51%
91,499
1.76%
Total Polled
63,840
71.51%
746,610
67.53%
5,186,256
55.87%
Registered Electors
89,277
1,105,583
9,283,143
Party
Kesbewa[ 11]
Colombo Electoral District
Sri Lanka
Votes
%
Votes
%
Votes
%
SLFP
26,553
47.92%
274,476
36.40%
2,546,348
39.05%
UNP
25,576
46.16%
436,290
57.86%
3,450,815
52.93%
JVP
2,248
4.06%
28,580
3.79%
273,428
4.19%
LSSP
851
1.54%
9,655
1.28%
58,531
0.90%
Other Parties (with < 1%)
179
0.32%
5,030
0.67%
190,929
2.93%
Valid Votes
55,407
99.05%
754,031
98.95%
6,520,156
98.78%
Rejected Votes
530
0.95%
7,990
1.05%
80,470
1.22%
Total Polled
55,937
78.78%
762,021
76.88%
6,600,626
80.15%
Registered Electors
71,002
991,194
8,235,358
Parliamentary Election Results
Summary
The winner of Kesbewa has matched the final country result 6 out of 7 times. Hence, Kesbewa is a Strong Bellwether for Parliamentary Elections.
Party
Kesbewa[ 14]
Colombo Electoral District
Sri Lanka
Votes
%
Votes
%
Votes
%
SLPFA
89,240
70.77%
674,603
57.04%
6,853,693
59.09%
SJB
23,687
18.78%
387,145
32.73%
2,771,984
23.9%
JJB
9,160
7.26%
67,600
5.72%
445,958
3.84%
UNP
2,098
1.66%
30,875
2.61%
249,435
2.15%
Other Parties (with < 1%)
1,918
1.53%
22,553
1.9%
1,227,859
11.02%
Valid Votes
126,103
70.34%
1,182,776
69.2%
11,598,936
71.32%
Rejected Votes
6,760
3.77%
81,034
4.74%
744,373
4.58%
Total Polled
132,863
74.11%
1,263,810
73.94%
12,343,309
75.89%
Registered Electors
179,289
1,709,209
16,263,885
Party
Kesbewa[ 15]
Colombo Electoral District
Sri Lanka
Votes
%
Votes
%
Votes
%
UPFA
65,243
51.30%
474,063
39.25%
4,732,664
42.48%
UNP
49,637
39.03%
640,743
53.04%
5,098,916
45.77%
JVP
11,193
8.80%
81,391
6.74%
544,154
4.88%
Other Parties (with < 1%)
1,110
0.87%
11,752
0.97%
93,045
0.84%
Valid Votes
127,183
97.32%
1,207,949
96.46%
11,140,333
95.35%
Rejected Votes
3,452
2.64%
43,372
3.46%
516,926
4.42%
Total Polled
130,692
79.32%
1,252,271
78.93%
11,684,111
77.66%
Registered Electors
164,774
1,586,598
15,044,490
Party
Kesbewa[ 16]
Colombo Electoral District
Sri Lanka
Votes
%
Votes
%
Votes
%
UPFA
60,139
62.57%
480,896
51.23%
4,846,388
60.38%
UNP
21,953
22.84%
339,750
36.19%
2,357,057
29.37%
DNA
13,532
14.08%
110,683
11.79%
441,251
5.50%
Other Parties (with < 1%)
493
0.51%
7,292
0.78%
48,240
0.60%
Valid Votes
96,117
95.79%
938,723
94.85%
8,026,322
96.03%
Rejected Votes
4,160
4.15%
50,354
5.09%
581,465
6.96%
Total Polled
100,339
67.48%
989,729
64.17%
8,358,246
59.29%
Registered Electors
148,696
1,542,457
14,097,690
Party
Kesbewa[ 17]
Colombo Electoral District
Sri Lanka
Votes
%
Votes
%
Votes
%
UPFA
45,939
44.63%
414,688
39.20%
4,223,126
45.70%
JHU
29,850
29.00%
190,618
18.02%
552,723
5.98%
UNP
26,302
25.55%
441,841
41.77%
3,486,792
37.73%
Other Parties (with < 1%)
846
0.82%
10,713
1.01%
90,868
0.98%
Valid Votes
102,937
97.32%
1,057,860
96.47%
9,241,931
94.52%
Rejected Votes
2,831
2.68%
38,605
3.52%
534,452
5.47%
Total Polled
105,773
77.05%
1,096,571
74.71%
9,777,821
75.74%
Registered Electors
137,285
1,467,751
12,909,631
Party
Kesbewa[ 18]
Colombo Electoral District
Sri Lanka
Votes
%
Votes
%
Votes
%
UNP
42,260
42.54%
546,417
51.62%
4,086,026
45.62%
PA
37,815
38.07%
353,401
33.39%
3,330,815
37.19%
JVP
16,045
16.15%
117,404
11.09%
815,353
9.10%
SU
2,170
2.18%
16,970
1.60%
50,665
0.57%
Other Parties (with < 1%)
1,049
1.06%
24,289
2.29%
510,616
5.70%
Valid Votes
99,339
96.73%
1,058,481
96.28%
8,955,844
94.77%
Rejected Votes
3,356
3.27%
40,901
3.72%
494,009
5.23%
Total Polled
102,695
78.05%
1,099,382
76.31%
9,449,878
76.03%
Registered Electors
131,571
1,440,682
12,428,762
Party
Kesbewa[ 19]
Colombo Electoral District
Sri Lanka
Votes
%
Votes
%
Votes
%
PA
41,977
44.40%
394,146
38.86%
3,899,329
45.33%
UNP
34,978
37.00%
440,684
43.45%
3,451,765
40.12%
JVP
10,219
10.81%
78,133
7.70%
518,725
6.03%
SU
6,211
6.57%
49,671
4.90%
127,859
1.49%
Other Parties (with < 1%)
1,148
1.21%
51,586
5.09%
375,083
4.36%
Valid Votes
94,533
N/A
1,014,220
N/A
8,602,617
N/A
Party
Kesbewa[ 20]
Colombo Electoral District
Sri Lanka
Votes
%
Votes
%
Votes
%
PA
49,342
59.16%
469,642
50.94%
3,887,805
48.94%
UNP
29,585
35.47%
385,100
41.77%
3,498,370
44.04%
MEP
2,709
3.25%
42,734
4.64%
68,538
0.86%
SLPF
1,418
1.70%
11,454
1.24%
90,078
1.13%
Other Parties (with < 1%)
349
0.42%
13,003
1.41%
51,995
0.65%
Valid Votes
83,403
96.60%
921,933
96.18%
7,943,688
95.20%
Rejected Votes
2,932
3.40%
36,635
3.82%
400,395
4.80%
Total Polled
86,335
77.82%
958,568
76.04%
8,344,095
74.75%
Registered Electors
110,948
1,260,686
11,163,064
Party
Kesbewa[ 21]
Colombo Electoral District
Sri Lanka
Votes
%
Votes
%
Votes
%
UNP
27,415
45.83%
374,530
51.67%
2,838,005
50.71%
SLFP
25,830
43.18%
205,053
28.29%
1,785,369
31.90%
MEP
4,351
7.27%
76,966
10.62%
90,480
1.62%
USA
1,890
3.16%
31,873
4.40%
141,983
2.54%
Other Parties (with < 1%)
339
0.57%
36,420
5.02%
269,739
4.82%
Valid Votes
59,825
95.67%
724,842
95.36%
5,596,468
93.87%
Rejected Votes
2,710
4.33%
35,271
4.64%
365,563
6.13%
Total Polled
62,535
71.38%
760,113
69.87%
5,962,031
63.60%
Registered Electors
87,609
1,087,891
9,374,164
Demographics
Ethnicity
The Kesbewa Polling Division has a Sinhalese majority (97.3%) . In comparison, the Colombo Electoral District (which contains the Kesbewa Polling Division) has a Sinhalese majority (76.5%), a significant Moor population (10.7%) and a significant Sri Lankan Tamil population (10.1%) [ 1]
Religion
The Kesbewa Polling Division has a Buddhist majority (93.0%) . In comparison, the Colombo Electoral District (which contains the Kesbewa Polling Division) has a Buddhist majority (70.2%) and a significant Muslim population (11.8%) [ 1]
References