Jacarezinho, Paraná
Jacarezinho | |
|---|---|
 Flag  Seal | |
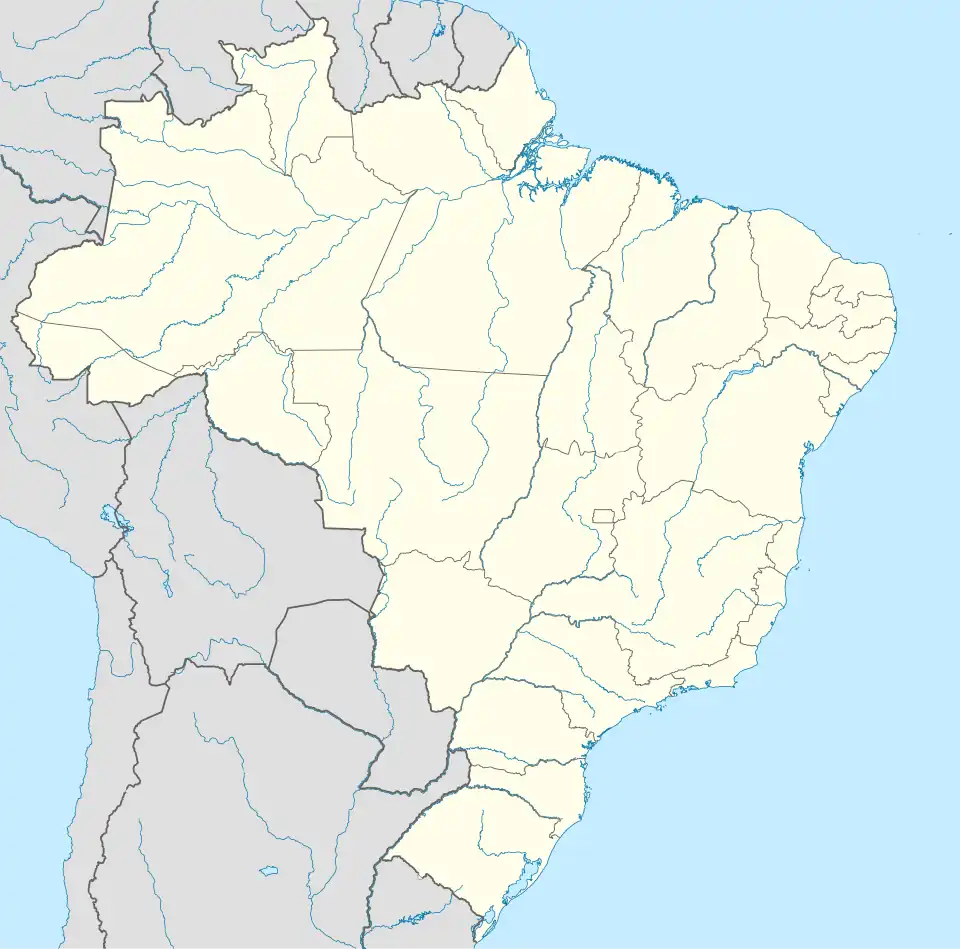 Jacarezinho Location in Brazil | |
| Coordinates: 23°09′39″S 49°58′08″W / 23.16083°S 49.96889°W | |
| Country | Brazil |
| State | Paraná |
| Government | |
| • Mayor | Dr. Sérgio Faria (DEM) |
| Area | |
• Total | 602 km2 (232 sq mi) |
| Elevation | 435 m (1,427 ft) |
| Population (2020 [1]) | |
• Total | 39,322 |
| • Density | 6,488/km2 (16,800/sq mi) |
| Time zone | UTC-3 (UTC-3) |
| Website | Jacarezinho Official Site |
Jacarezinho is a municipality in the state of Paraná in Brazil, with around 39,000 inhabitants. It is situated at 23°9′38″S 49°58′10″W / 23.16056°S 49.96944°W near the Jacaré River and it is a major center for the region. Its economy is made up of 34% industries, 55% services (education plays a big part), 11% agriculture (sugar cane, coffee and cattle). The city is the seat of the Roman Catholic Diocese of Jacarezinho.
Climate
| Climate data for Jacarezinho, Paraná (1981–2010) | |||||||||||||
|---|---|---|---|---|---|---|---|---|---|---|---|---|---|
| Month | Jan | Feb | Mar | Apr | May | Jun | Jul | Aug | Sep | Oct | Nov | Dec | Year |
| Mean daily maximum °C (°F) | 31.4 (88.5) |
30.6 (87.1) |
30.1 (86.2) |
28.7 (83.7) |
25.8 (78.4) |
24.8 (76.6) |
25.3 (77.5) |
26.7 (80.1) |
27.6 (81.7) |
29.5 (85.1) |
30.4 (86.7) |
30.4 (86.7) |
28.4 (83.1) |
| Daily mean °C (°F) | 24.9 (76.8) |
24.2 (75.6) |
23.5 (74.3) |
21.7 (71.1) |
18.8 (65.8) |
16.9 (62.4) |
17.0 (62.6) |
18.5 (65.3) |
19.9 (67.8) |
22.2 (72.0) |
23.5 (74.3) |
24.0 (75.2) |
21.3 (70.3) |
| Mean daily minimum °C (°F) | 20.2 (68.4) |
19.9 (67.8) |
19.0 (66.2) |
16.8 (62.2) |
14.1 (57.4) |
11.4 (52.5) |
11.3 (52.3) |
12.4 (54.3) |
14.1 (57.4) |
16.5 (61.7) |
18.0 (64.4) |
19.1 (66.4) |
16.1 (61.0) |
| Average precipitation mm (inches) | 217.5 (8.56) |
183.9 (7.24) |
136.6 (5.38) |
108.1 (4.26) |
116.1 (4.57) |
70.4 (2.77) |
38.8 (1.53) |
39.7 (1.56) |
99.2 (3.91) |
113.4 (4.46) |
152.0 (5.98) |
186.7 (7.35) |
1,462.4 (57.57) |
| Average relative humidity (%) | 77.3 | 79.1 | 78.3 | 78.1 | 82.6 | 79.2 | 71.3 | 66.4 | 66.7 | 67.4 | 69.2 | 74.0 | 74.1 |
| Source: Instituto Nacional de Meteorologia[2] | |||||||||||||
References
- ^ IBGE 2020
- ^ "Normais Climatológicas Do Brasil 1981–2010" (in Portuguese). Instituto Nacional de Meteorologia. Retrieved 21 May 2024.