International rankings of South Korea
The following are international rankings of South Korea.
Outline
| Name | Classification | Reference | |
|---|---|---|---|
| FTSE | Developed market | [1] | |
| Emerging market | |||
| Frontier market | |||
| Name | Classification | Reference | |
|---|---|---|---|
| S&P | Developed market | [2] | |
| Emerging market | |||
| Frontier market | |||
| Name | Classification | Reference | |
|---|---|---|---|
| IMF | Advanced economy | [3] | |
| Emerging and Developing Economies | |||
| Name | Classification | Reference | |
|---|---|---|---|
| DAC | Member | [4] | |
| Non-member | |||
| Name | Classification | Reference | |
|---|---|---|---|
| Paris Club | Member | [5] | |
| Non-member | |||
| Name | Classification | Reference | |
|---|---|---|---|
| World Bank | High income | [6] | |
| Middle income | |||
| Low income | |||
Economy
.jpeg)
Education
| Name | Year | Place | Out of # | Reference |
|---|---|---|---|---|
| OECD – Attained a tertiary education degree, 25- to 34-year-olds % | 2011 | 4 | 35 | [35] |
| OECD Programme for International Student Assessment – Maths | 2012 | 8 | 34 | [36] |
| OECD Programme for International Student Assessment – Reading | 2012 | 2 | 34 | [37] |
| OECD Programme for International Student Assessment – Science | 2012 | 4 | 34 | [38] |
| Trends in International Mathematics and Science Study – 4th Grade Math | 2011 | 2 | 52 | [39] |
| Trends in International Mathematics and Science Study – 8th Grade Math | 2011 | 9 | 52 | [40] |
| Trends in International Mathematics and Science Study – 4th Grade Science | 2011 | 23 | 52 | [41] |
| Trends in International Mathematics and Science Study – 8th Grade Science | 2011 | 3 | 52 | [42] |
| Institute for Health Metrics and Evaluation – Women's average years in school | 2010 | 3 | 206 | [43] |
Environment
| Name | Year | Place | Out of # | Reference |
|---|---|---|---|---|
| Yale University / Columbia University – Environmental Performance Index | 2014 | 43 | 178 | [44] |
| United Nations University for Environment and Human Security – World Risk Index | 2013 | 62 | 172 | [45] |
Health & Safety
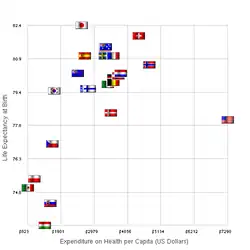
Note: In the case of statistics with potentially conflicting meanings, the rankings have been converted to reflect the same direction – Positive statistics rank higher, while negative statistics rank lower.
| Name | Year | Place | Out of # | Reference |
|---|---|---|---|---|
| WHO – Risk of death from non-communicable disease | 2008 | 9 | 194 | [46] |
| OECD – Life expectancy | 2013 | 11 | 34 | [47] |
| WHO – Infant mortality | 2005–2010 | 19 | 193 | [48] |
| WHO – Health expenditure covered by government | 2012 | 31 | 34 | [49] |
| OECD – Obesity rate | 2009 | 5 | 34 | [50] |
| OECD – Hospital beds | 2011 | 2 | 34 | [51] |
| OECD – Alcohol consumption | 2011 | 13 | 34 | [52] |
| OECD – Smoking rate | 2010 | 26 | 41 | [53] |
| OECD – Cancer rate | 2012 | 27 | 34 | [54] |
| OECD – Colorectal cancer 5-year survival rate | 2006–2011 | 9 | 23 | [55] |
| OECD – Hemorrhagic stroke 30 day in-hospital mortality | 2011 | 3 | 32 | [56] |
| OECD – Ischemic stroke 30 day in-hospital mortality | 2011 | 2 | 33 | [57] |
| Intentional homicide rate | 2011 | 6 | 192 | [58] |
Industry

| Name | Year | Place | Out of # | Reference |
|---|---|---|---|---|
| OICA – Automobile production | 2023 | 5 | 49 | [59] |
| IAEA – Nuclear energy production | 2012 | 5 | [60] | |
| World Steel Association – Steel production | 2017 | 6 | 40 | [61] |
| The World Factbook – Electricity production | 2017 | 9 | 211 | [62] |
| Stockholm International Peace Research Institute – Arms exports | 2013 | 13 | 154 | [63] Archived 2016-04-22 at the Wayback Machine |
Innovation
| Name | Year | Place | Out of # | Reference |
|---|---|---|---|---|
| World Intellectual Property Indicators – Patent applications per GDP | 2012 | 8 | 206 | [64] |
| World Intellectual Property Indicators – Patent applications per million population | 2012 | 6 | 206 | [65] |
| World Intellectual Property Indicators – Application design counts per million population | 2012 | 8 | 206 | [66] |
| World Intellectual Property Indicators – Patent grants | 2012 | 4 | 206 | [67] |
| World Intellectual Property Indicators – Industrial design registrations in force | 2012 | 3 | 206 | [68] |
| Bloomberg Innovation Index | 2016 | 7 | 50 | Bloomberg Innovation Index |
| The Boston Consulting Group – International Innovation Index | 2009 | 2 | 110 | [69] Archived 2021-06-16 at the Wayback Machine |
| WIPO – Global Innovation Index | 2024 | 6 | 133 | [1] |
| Research and development spending - % of GDP | 2012 | 9 | 72 | [70] |
| Research and development spending – Total | 2011 | 5 | 72 | [71] |
Politics, Law and Military


| Name | Year | Place | Out of # | Reference |
|---|---|---|---|---|
| Transparency International – Global Corruption Barometer | 2013 | 6 | 95 | [72] |
| OECD – Government transparency | 2008 | 6 | 34 | [73] |
| Composite Index of National Capability | 2007 | 8 | 193 | [74] |
| Stockholm International Peace Research Institute – Defense budget | 2013 | 10 | 154 | [75] |
| World Justice Project – Rule of Law Index | 2015 | 11 | 102 | [76] |
| Nation brand power | 2013 | 12 | 40 | [77] |
| Transparency International – Bribe Payers Index | 2013 | 13 | 28 | [78] |
| The Economist Intelligence Unit – Democracy Index | 2012 | 20 | 167 | [79] |
| Fund for Peace – Fragile State Index | 2013 | 23 | 178 | [80] |
| Nation Brand Index | 2023 | 24 | 49 | [81] |
| Property Rights Alliance – International Property Rights Index | 2013 | 37 | 130 | [82] |
| Transparency International – Corruption Perception Index | 2015 | 37 | 177 | [83] Archived 2019-11-13 at the Wayback Machine |
| Institute for Economics and Peace – Global Peace Index | 2015 | 42 | 162 | [84] |
| Reporters Without Borders – Press Freedom Index | 2023 | 47 | 180 | [85] |
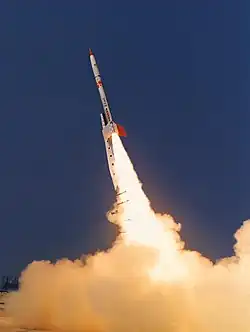
Science & Technology
_Active_5-door_hatchback_(2018-08-06)_01.jpg)


| Name | Year | Place | Out of # | Reference |
|---|---|---|---|---|
| Google – Smartphone penetration | 2018 | 4 | 48 | [86] Archived 2018-12-26 at the Wayback Machine |
| ClinicalTrials.gov – Stem cell research trials | 2014 | 3 | 11 | [87] |
| Space Competitiveness Index | 2024 | 7 | 15 | [88] |
| World Wide Web Foundation – Web index | 2014 | 8 | 81 | [89] |
| World Economic Forum – Networked Readiness Index | 2014 | 10 | 145 | [90] |
| United Nations – E-Government Development Index | 2022 | 3 | 193 | [91] |
| United Nations – E-Participation Index | 2022 | 9 | 193 | [92] |
| United Nations – Online Service Index | 2022 | 3 | 193 | [93] |
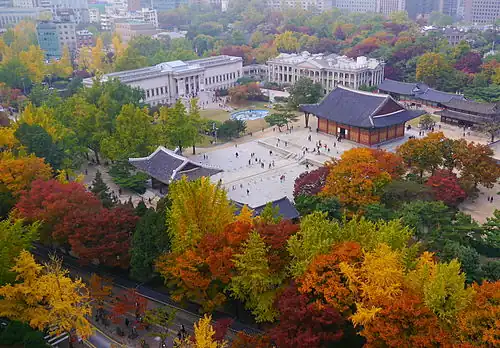
Society & Quality of Life
Tourism
| Name | Year | Place | Out of # | Reference |
|---|---|---|---|---|
| World Tourism Organization – World Tourism rankings | 2013 | 23 | 193 | [111] |
| World Economic Forum – Travel and Tourism Competitiveness Report | 2013 | 15 | 140 | [112] |
| UNESCO – World Heritage Site | 2023 | 22 | 34 | [113] |
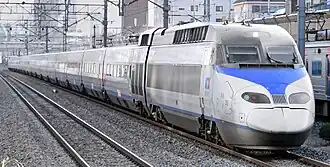
Transportation
| Name | Year | Place | Out of # | Reference |
|---|---|---|---|---|
| The World Factbook – Number of Heliports | 2013 | 2 | 192 | [114] |
| The World Factbook – Expressway density | 2009 | 8 | 192 | [115] |
Culture
| Name | Year | Place | Out of # | Reference |
|---|---|---|---|---|
| Brand Finance – Global Soft Power Index | 2023 | 15 | - | [116] |
See also
- International rankings of North Korea
- International rankings of China
- International rankings of Japan
References
- ^ World Intellectual Property Organization (2024). "Global Innovation Index 2024: Unlocking the Promise of Social Entrepreneurship". www.wipo.int. p. 18. doi:10.34667/tind.50062. ISBN 978-92-805-3681-2. Retrieved 2024-10-06.
- ^ "Ministry of Employment and Labor, 2015 hours in 2013".
International rankings of Asia | |
|---|---|
| Sovereign states |
|
| States with limited recognition |
|
| Dependencies and other territories |
|
| |