| 9th constituency of Gironde |
|---|
|
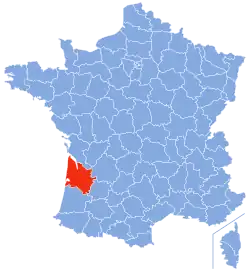
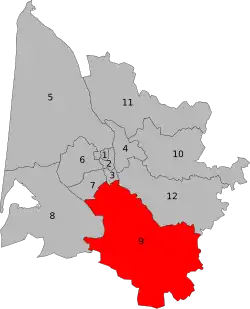 Location of constituency in Department |
 |
| Deputy | |
|---|
| Department | Gironde |
|---|
| Cantons | (pre-2015) Auros, Cadillac, Créon, Langon, Monségur, Podensac, Réole, Saint-Macaire, Sauveterre-de-Guyenne, Targon. |
|---|
|
The 9th constituency of the Gironde (French: Neuvième circonscription de la Gironde) is a French legislative constituency in Gironde département. Like the other 576 French constituencies, it elects one MP using the two-round system, with a run-off if no candidate receives over 50% of the vote in the first round.
Historical representation
Election results
2024
| Candidate
|
Party
|
Alliance
|
First round
|
Second round
|
| Votes
|
%
|
+/–
|
Votes
|
%
|
+/–
|
|
|
François-Xavier Marques
|
RN
|
|
27,868
|
38.54
|
+15.10
|
30,337
|
43.01
|
new
|
|
|
Sophie Mette
|
MoDEM
|
Ensemble
|
21,714
|
30.03
|
+1.28
|
40,190
|
56.99
|
+6.50
|
|
|
Corinne Martinez
|
PS
|
NFP
|
20,163
|
27.89
|
+3.66
|
|
|
|
|
|
Jean-Philippe Delcamp
|
LO
|
|
1,368
|
1.89
|
+0.33
|
|
|
|
Sylvie Mantel
|
REC
|
|
1,188
|
1.64
|
-2.53
|
|
|
| Votes
|
72,301
|
100.00
|
|
70,527
|
100.00
|
|
|
|
| Valid votes
|
72,301
|
96.45
|
-0.70
|
70,527
|
94.32
|
+4.64
|
| Blank votes
|
1,885
|
2.51
|
+0.42
|
3,077
|
4.12
|
-3.22
|
| Null votes
|
776
|
1.04
|
+0.28
|
1,167
|
1.56
|
-1.42
|
| Turnout
|
74,962
|
72.19
|
+20.57
|
74,771
|
71.98
|
+22.38
|
| Abstentions
|
28,885
|
27.81
|
-20.57
|
29,106
|
28.02
|
-22.38
|
| Registered voters
|
103,847
|
|
103,877
|
|
|
|
| Source: [1]
|
| Result
|
MoDEM HOLD
|
2022
[1]
2017
| Candidate
|
Label
|
First round
|
Second round
|
| Votes
|
%
|
Votes
|
%
|
|
|
Sophie Mette
|
MoDem
|
14,888
|
31.21
|
18,059
|
53.54
|
|
|
Gilles Savary
|
PS
|
8,289
|
17.38
|
15,674
|
46.46
|
|
|
François Papiau
|
FI
|
6,844
|
14.35
|
|
|
|
Michel Dufranc
|
LR
|
6,201
|
13.00
|
|
|
Sophie Rivière Durivault
|
FN
|
5,938
|
12.45
|
|
|
Dominique Baude
|
ECO
|
2,130
|
4.47
|
|
|
Cristine Guerné
|
PCF
|
977
|
2.05
|
|
|
Rémy Berthonneau
|
DLF
|
952
|
2.00
|
|
|
Jean-Philippe Delcamp
|
EXG
|
442
|
0.93
|
|
|
Antoine Courjaud
|
DVG
|
362
|
0.76
|
|
|
Fanny Loustau
|
DIV
|
339
|
0.71
|
|
|
Xavier de Jaeger
|
DIV
|
326
|
0.68
|
|
|
Patrick Dhersin
|
ECO
|
12
|
0.03
|
|
|
| Votes
|
47,700
|
100.00
|
33,733
|
100.00
|
|
|
| Valid votes
|
47,700
|
97.69
|
33,733
|
84.81
|
| Blank votes
|
784
|
1.61
|
4,031
|
10.14
|
| Null votes
|
344
|
0.70
|
2,009
|
5.05
|
| Turnout
|
48,828
|
52.17
|
39,773
|
42.49
|
| Abstentions
|
44,766
|
47.83
|
53,825
|
57.51
|
| Registered voters
|
93,594
|
|
93,598
|
|
|
|
| Source: Ministry of the Interior[2]
|
2012
2012 legislative election in Gironde's 9th constituency[3]
| Candidate
|
Party
|
First round
|
Second round
|
| Votes
|
%
|
Votes
|
%
|
|
|
Gilles Savary
|
PS
|
21,253
|
40.88%
|
30,429
|
63.49%
|
|
|
Maxime Sibe
|
UMP
|
12,077
|
23.23%
|
17,497
|
36.51%
|
|
|
Pierre Augey
|
FG
|
6,437
|
12.38%
|
|
|
|
Valérie Colombier
|
FN
|
5,896
|
11.34%
|
|
|
Sophie Mette
|
MoDem
|
1,969
|
3.79%
|
|
|
Yann Persillon
|
EELV
|
1,806
|
3.47%
|
|
|
Gaël Leroux
|
CPNT
|
814
|
1.57%
|
|
|
Guillaume Besset
|
AEI
|
420
|
0.81%
|
|
|
Martine Hostier
|
DLR
|
389
|
0.75%
|
|
|
Hervé Riou
|
NPA
|
329
|
0.63%
|
|
|
Jean-Philippe Delcamp
|
LO
|
306
|
0.59%
|
|
|
Alain Jeanmougin
|
PP
|
211
|
0.41%
|
|
|
Gérard Laguerie
|
AR
|
86
|
0.17%
|
|
|
| Valid votes
|
51,993
|
98.32%
|
47,926
|
95.76%
|
| Spoilt and null votes
|
888
|
1.68%
|
2,124
|
4.24%
|
| Votes cast / turnout
|
52,881
|
61.73%
|
50,050
|
58.42%
|
| Abstentions
|
32,779
|
38.27%
|
35,630
|
41.58%
|
| Registered voters
|
85,660
|
100.00%
|
85,680
|
100.00%
|
2007
2002
1997
Sources
Constituencies Gironde (12) |
|---|
|