Electoral results for the Division of Lyons (state, 1972-present)
This is a list of electoral results for the division of Lyons in Tasmanian elections since 1972.
Election results
Elections in the 2020s
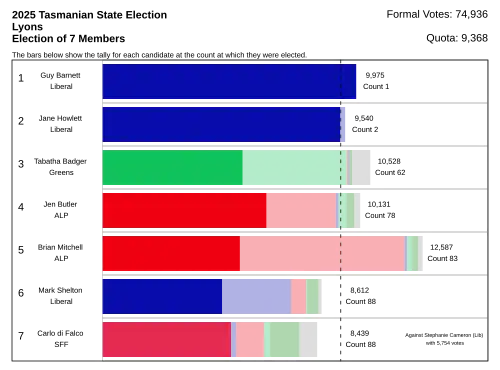
2025
| Party | Candidate | Votes | % | ±% | |
|---|---|---|---|---|---|
| Quota | 9,257 | ||||
| Liberal | Guy Barnett (elected 1) | 9,975 | 13.3 | +2.2 | |
| Liberal | Jane Howlett (elected 2) | 9,346 | 12.5 | +3.3 | |
| Liberal | Mark Shelton (elected 6) | 4,698 | 6.3 | −0.7 | |
| Liberal | Stephanie Cameron | 2,793 | 3.7 | −0.2 | |
| Liberal | Richard Hallett | 2,129 | 2.8 | +0.3 | |
| Liberal | Poppy Lyne | 1,544 | 2.1 | +2.1 | |
| Liberal | Bree Groves | 996 | 1.3 | +1.3 | |
| Labor | Jen Butler (elected 4) | 6,445 | 8.6 | +5.4 | |
| Labor | Brian Mitchell (elected 5) | 5,400 | 7.2 | +7.2 | |
| Labor | Richard Goss | 2,674 | 3.6 | +1.2 | |
| Labor | Casey Farrell | 2,640 | 3.5 | +1.9 | |
| Labor | Sharon Campbell | 1,732 | 2.3 | +2.3 | |
| Labor | Edwin Batt | 1,428 | 1.9 | +0.5 | |
| Labor | Saxon O'Donnell | 990 | 1.3 | +1.3 | |
| Greens | Tabatha Badger (elected 3) | 5,507 | 7.3 | +1.8 | |
| Greens | Hannah Rubenach-Quinn | 1,053 | 1.4 | −0.1 | |
| Greens | Alistair Allan | 932 | 1.2 | +0.4 | |
| Greens | Isabel Shapcott | 813 | 1.1 | +1.1 | |
| Greens | Craig Brown | 776 | 1.0 | +0.0 | |
| Greens | Mitch Houghton | 563 | 0.8 | +0.1 | |
| Greens | Joey Cavanagh | 514 | 0.7 | +0.7 | |
| Shooters, Fishers, Farmers | Carlo Di Falco (elected 7) | 5,050 | 6.7 | +5.9 | |
| National | John Tucker | 1,608 | 2.1 | −1.0 | |
| National | Andrew Jenner | 833 | 1.1 | −1.8 | |
| National | Lesley Pyecroft | 273 | 0.4 | −2.1 | |
| National | Rick Mandelson | 1,841 | 0.4 | +0.4 | |
| National | Francis Haddon-Cave | 200 | 0.3 | +0.3 | |
| Independent | Angela Offord | 941 | 1.3 | +1.0 | |
| Independent | Michelle Dracoulis | 845 | 1.1 | +1.1 | |
| Independent | Jiri Lev | 498 | 0.7 | +0.7 | |
| Independent | John Hawkins | 475 | 0.6 | +0.6 | |
| Independent | Phillip Bigg | 364 | 0.5 | −0.5 | |
| Independent | Ray Broomhall | 256 | 0.3 | +0.3 | |
| Independent | Tenille Murtagh | 193 | 0.3 | +0.3 | |
| Independent | Paul Dare | 189 | 0.3 | +0.3 | |
| Total formal votes | 74,936 | 63.4 | +1.0 | ||
| Informal votes | 5,293 | 6.6 | −1.0 | ||
| Turnout | 80,229 | 89.7 | −1.3 | ||
| Party total votes | |||||
| Liberal | 31,481 | 42.0 | +4.4 | ||
| Labor | 21,309 | 28.4 | -4.3 | ||
| Greens | 10,158 | 13.6 | +2.7 | ||
| Shooters, Fishers, Farmers | 5,050 | 6.7 | +2.0 | ||
| National | 3,177 | 4.2 | +4.2 | ||
| Independent | Angela Offord | 941 | 1.3 | +1.0 | |
| Independent | Michelle Dracoulis | 845 | 1.1 | +1.1 | |
| Independent | Jiri Lev | 498 | 0.7 | +0.7 | |
| Independent | John Hawkins | 475 | 0.6 | +0.6 | |
| Independent | Phillip Bigg | 364 | 0.5 | −0.5 | |
| Independent | Ray Broomhall | 256 | 0.3 | +0.3 | |
| Independent | Tenille Murtagh | 193 | 0.3 | +0.3 | |
| Independent | Paul Dare | 189 | 0.3 | +0.3 | |
| Shooters, Fishers and Farmers gain from Lambie Network | |||||
2024
| Party | Candidate | Votes | % | ±% | |
|---|---|---|---|---|---|
| Quota | 9,257 | ||||
| Liberal | Guy Barnett (elected 2) | 8,252 | 11.1 | −9.7 | |
| Liberal | Jane Howlett (elected 3) | 6,843 | 9.2 | +9.2 | |
| Liberal | Mark Shelton (elected 5) | 5,184 | 7.0 | −5.1 | |
| Liberal | Stephanie Cameron | 2,865 | 3.9 | −0.6 | |
| Liberal | Richard Hallett | 1,867 | 2.5 | +2.5 | |
| Liberal | Justin Derksen | 1,483 | 2.0 | +2.0 | |
| Liberal | Gregory Brown | 1,353 | 1.8 | +1.8 | |
| Labor | Rebecca White (elected 1) | 15,607 | 21.1 | −1.9 | |
| Labor | Jen Butler (elected 4) | 2,363 | 3.2 | −0.5 | |
| Labor | Richard Goss | 1,790 | 2.4 | +2.4 | |
| Labor | Ben Dudman | 1,491 | 2.0 | +2.0 | |
| Labor | Casey Farrell | 1,182 | 1.6 | +1.6 | |
| Labor | Edwin Batt | 1,063 | 1.4 | −0.2 | |
| Labor | Carole McQueeney | 780 | 1.1 | +1.1 | |
| Greens | Tabatha Badger (elected 7) | 4,044 | 5.5 | +5.5 | |
| Greens | Hannah Rubenach-Quinn | 1,117 | 1.5 | +1.5 | |
| Greens | Craig Brown | 741 | 1.0 | +1.0 | |
| Greens | Alistair Allan | 620 | 0.8 | +0.8 | |
| Greens | Glenn Millar | 520 | 0.7 | −0.0 | |
| Greens | Mitch Houghton | 516 | 0.7 | +0.7 | |
| Greens | Gary Whisson | 489 | 0.7 | +0.7 | |
| Lambie | Andrew Jenner (elected 6) | 2,177 | 2.9 | +2.9 | |
| Lambie | Troy Pfitzner | 2,127 | 2.9 | +2.9 | |
| Lambie | Lesley Pyecroft | 1,841 | 2.5 | +2.5 | |
| Shooters, Fishers, Farmers | Ray Williams | 953 | 1.3 | +1.3 | |
| Shooters, Fishers, Farmers | Shane Broadby | 755 | 1.0 | +1.0 | |
| Shooters, Fishers, Farmers | Phillip Bigg | 715 | 1.0 | +1.0 | |
| Shooters, Fishers, Farmers | Carlo Di Falco | 599 | 0.8 | −3.7 | |
| Shooters, Fishers, Farmers | Wayne Turale | 511 | 0.7 | +0.7 | |
| Independent | John Tucker | 2,309 | 3.1 | −3.4 | |
| Animal Justice | Anna Megan Gralton | 1,213 | 1.6 | +1.6 | |
| Independent | Angela Offord | 214 | 0.3 | +0.3 | |
| Independent | Loueen (Lou) Triffitt | 175 | 0.2 | +0.2 | |
| Independent | Andrew Roberts | 130 | 0.2 | +0.2 | |
| Independent | Jenny Branch-Allen | 92 | 0.1 | +0.1 | |
| Independent | Fraser Miller | 70 | 0.1 | +0.1 | |
| Total formal votes | 74,051 | 92.8 | −1.2 | ||
| Informal votes | 5,769 | 7.2 | +1.2 | ||
| Turnout | 79,820 | 91.0 | −0.1 | ||
| Party total votes | |||||
| Liberal | 27,847 | 37.6 | −13.6 | ||
| Labor | 24,276 | 32.8 | +0.2 | ||
| Greens | 8,047 | 10.9 | +2.0 | ||
| Lambie | 6,145 | 8.3 | +8.3 | ||
| Shooters, Fishers, Farmers | 3,533 | 4.8 | +0.3 | ||
| Independent | John Tucker | 2,309 | 3.1 | −3.4 | |
| Animal Justice | 1,213 | 1.6 | +1.6 | ||
| Independent | Angela Offord | 214 | 0.3 | +0.3 | |
| Independent | Loueen (Lou) Triffitt | 175 | 0.2 | +0.2 | |
| Independent | Andrew Roberts | 130 | 0.2 | +0.2 | |
| Independent | Jenny Branch-Allen | 92 | 0.1 | +0.1 | |
| Independent | Fraser Miller | 70 | 0.1 | +0.1 | |
2021
| Party | Candidate | Votes | % | ±% | |
|---|---|---|---|---|---|
| Quota | 11,839 | ||||
| Liberal | Guy Barnett (elected 2) | 14,821 | 20.9 | +7.2 | |
| Liberal | Mark Shelton (elected 3) | 8,613 | 12.1 | +0.0 | |
| Liberal | John Tucker (elected 5) | 4,619 | 6.5 | +1.6 | |
| Liberal | Stephanie Cameron | 3,168 | 4.5 | +4.5 | |
| Liberal | Justin Derksen | 2,622 | 3.7 | +3.7 | |
| Liberal | Susie Bower | 2,517 | 3.5 | +3.5 | |
| Labor | Rebecca White (elected 1) | 16,338 | 23.0 | −0.6 | |
| Labor | Jen Butler (elected 4) | 2,635 | 3.7 | +1.4 | |
| Labor | Janet Lambert | 2,278 | 3.2 | +0.6 | |
| Labor | Edwin Batt | 1,141 | 1.6 | +1.6 | |
| Labor | Gerard Gaffney | 721 | 1.0 | −0.1 | |
| Greens | Liz Johnstone | 2,883 | 4.1 | +4.1 | |
| Greens | Tim Morris | 1,502 | 2.1 | +2.1 | |
| Greens | Jill Pierce | 737 | 1.0 | +1.0 | |
| Greens | Isabel Shapcott | 660 | 0.9 | +0.9 | |
| Greens | Glenn Millar | 511 | 0.7 | 0.0 | |
| Shooters, Fishers, Farmers | Carlo Di Falco | 3,175 | 4.5 | +4.5 | |
| Animal Justice | Sharon McLay | 1,411 | 2.0 | +2.0 | |
| Independent | George Lane | 674 | 0.9 | +0.9 | |
| Total formal votes | 71,026 | 94.0 | −0.3 | ||
| Informal votes | 4,539 | 6.0 | +0.3 | ||
| Turnout | 75,565 | 91.1 | −1.4 | ||
| Party total votes | |||||
| Liberal | 36,360 | 51.2 | +0.6 | ||
| Labor | 23,113 | 32.5 | −0.4 | ||
| Greens | 6,293 | 8.9 | +2.3 | ||
| Shooters, Fishers, Farmers | 3,175 | 4.5 | +4.5 | ||
| Animal Justice | 1,411 | 2.0 | +2.0 | ||
| Independent | George Lane | 674 | 0.9 | +0.9 | |
| Liberal hold | Swing | +7.2 | |||
| Liberal hold | Swing | +0.0 | |||
| Liberal hold | Swing | +1.6 | |||
| Labor hold | Swing | –0.6 | |||
| Labor hold | Swing | +1.4 | |||
Elections in the 2010s
2018
| Party | Candidate | Votes | % | ±% | |
|---|---|---|---|---|---|
| Quota | 11,538 | ||||
| Liberal | Guy Barnett (elected 2) | 9,454 | 13.7 | −1.0 | |
| Liberal | Rene Hidding (elected 4) | 8,504 | 12.3 | −4.4 | |
| Liberal | Mark Shelton (elected 3) | 8,374 | 12.1 | −0.0 | |
| Liberal | Jane Howlett | 5,259 | 7.6 | +7.6 | |
| Liberal | John Tucker | 3,404 | 4.9 | +4.9 | |
| Labor | Rebecca White (elected 1) | 16,338 | 23.6 | +10.7 | |
| Labor | Janet Lambert | 1,783 | 2.6 | +2.6 | |
| Labor | Jen Butler (elected 5) | 1,616 | 2.3 | +2.3 | |
| Labor | Darren Clark | 1,401 | 2.0 | +0.4 | |
| Labor | Kylie Wright | 920 | 1.3 | +1.3 | |
| Labor | Gerard Gaffney | 752 | 1.1 | +1.1 | |
| Greens | Fraser Brindley | 1,905 | 2.8 | +2.8 | |
| Greens | Lucy Landon-Lane | 832 | 1.2 | +1.2 | |
| Greens | Helen Hutchinson | 818 | 1.2 | +1.2 | |
| Greens | Glenn Millar | 501 | 0.7 | −0.0 | |
| Greens | Gary Whisson | 463 | 0.7 | +0.7 | |
| Lambie | Michael Kent | 1,977 | 2.9 | +2.9 | |
| Lambie | Chris Reynolds | 1,044 | 1.5 | +1.5 | |
| Lambie | Bob Vervaart | 768 | 1.1 | +1.1 | |
| Shooters, Fishers, Farmers | Shane Broadby | 623 | 0.9 | +0.9 | |
| Shooters, Fishers, Farmers | Andrew Harvey | 621 | 0.9 | +0.9 | |
| Shooters, Fishers, Farmers | Matthew Allen | 596 | 0.9 | +0.9 | |
| Shooters, Fishers, Farmers | Wayne Turale | 535 | 0.8 | +0.8 | |
| Shooters, Fishers, Farmers | Carlo Di Falco | 423 | 0.6 | +0.6 | |
| Independent | Kim Peart | 158 | 0.2 | +0.2 | |
| Independent | Tennille Murtagh | 153 | 0.2 | +0.2 | |
| Total formal votes | 69,222 | 94.8 | +0.3 | ||
| Informal votes | 3,791 | 5.5 | −0.3 | ||
| Turnout | 73,013 | 92.1 | −1.7 | ||
| Party total votes | |||||
| Liberal | 34,995 | 50.6 | −1.4 | ||
| Labor | 22,810 | 33.0 | +5.3 | ||
| Greens | 4,519 | 6.5 | −4.9 | ||
| Lambie | 3,484 | 5.0 | +5.0 | ||
| Shooters, Fishers, Farmers | 2,333 | 3.4 | +3.4 | ||
| Independent | Kim Peart | 158 | 0.2 | +0.2 | |
| Independent | Tennille Murtagh | 153 | 0.2 | +0.2 | |
| Liberal hold | Swing | –1.0 | |||
| Liberal hold | Swing | –4.4 | |||
| Liberal hold | Swing | –0.0 | |||
| Labor hold | Swing | +10.7 | |||
| Labor hold | Swing | +2.3 | |||
2014
| Party | Candidate | Votes | % | ±% | |
|---|---|---|---|---|---|
| Quota | 11,060 | ||||
| Liberal | Rene Hidding (elected 1) | 11,097 | 16.7 | +4.9 | |
| Liberal | Guy Barnett (elected 2) | 9,741 | 14.7 | +14.7 | |
| Liberal | Mark Shelton (elected 4) | 8,060 | 12.1 | +3.9 | |
| Liberal | Martyn Evans | 3,005 | 4.5 | +4.5 | |
| Liberal | Bertrand Cadart | 2,560 | 3.9 | +3.9 | |
| Labor | Rebecca White (elected 3) | 8,589 | 12.9 | +2.9 | |
| Labor | David Llewellyn (elected 5) | 5,262 | 7.9 | −2.4 | |
| Labor | Bob Gordon | 2,724 | 4.1 | +4.1 | |
| Labor | Darren Clark | 1,080 | 1.6 | +1.6 | |
| Labor | Jessey Dillon | 719 | 1.1 | +1.1 | |
| Greens | Tim Morris | 5,140 | 7.7 | −6.4 | |
| Greens | Hannah Rubenach | 668 | 1.0 | +1.0 | |
| Greens | Pip Brinklow | 655 | 1.0 | +1.0 | |
| Greens | Stephanie Taylor | 604 | 0.9 | +0.9 | |
| Greens | Glenn Millar | 498 | 0.8 | +0.8 | |
| Palmer United | Quentin Von Stieglitz | 1,658 | 2.5 | +2.5 | |
| Palmer United | Wayne Shoobridge | 1,233 | 1.9 | +1.9 | |
| Palmer United | Mark Grewar | 867 | 1.3 | +1.3 | |
| Independent | Paul Belcher | 1,252 | 1.9 | +1.9 | |
| National | Craig Davey | 295 | 0.4 | +0.4 | |
| National | Brett Hall | 243 | 0.4 | +0.4 | |
| National | Anne Salt | 122 | 0.2 | +0.2 | |
| National | Leo Perotti | 89 | 0.1 | +0.1 | |
| Independent | Murray Stewart | 193 | 0.3 | +0.3 | |
| Total formal votes | 66,354 | 94.5 | −0.5 | ||
| Informal votes | 3,828 | 5.5 | +0.5 | ||
| Turnout | 70,182 | 93.8 | +0.1 | ||
| Party total votes | |||||
| Liberal | 34,463 | 51.9 | +15.8 | ||
| Labor | 18,374 | 27.7 | −15.1 | ||
| Greens | 7,565 | 11.4 | −9.7 | ||
| Palmer United | 3,758 | 5.7 | +5.7 | ||
| Independent | Paul Belcher | 1,252 | 1.9 | +1.9 | |
| National | 749 | 1.1 | +1.1 | ||
| Independent | Murray Stewart | 193 | 0.3 | +0.3 | |
| Liberal hold | Swing | +4.9 | |||
| Liberal hold | Swing | +14.7 | |||
| Liberal gain from Greens | Swing | +3.9 | |||
| Labor hold | Swing | +2.9 | |||
| Labor hold | Swing | –2.4 | |||
2010
| Party | Candidate | Votes | % | ±% | |
|---|---|---|---|---|---|
| Quota | 10,741 | ||||
| Labor | Michael Polley (elected 4) | 8,302 | 12.9 | −8.3 | |
| Labor | David Llewellyn | 6,612 | 10.3 | −8.1 | |
| Labor | Rebecca White (elected 5) | 6,453 | 10.0 | +10.0 | |
| Labor | Heather Butler | 2,540 | 3.9 | −2.1 | |
| Labor | Nick Wright | 2,357 | 3.7 | +3.7 | |
| Labor | Brendan Sullivan | 1,293 | 2.0 | +2.0 | |
| Liberal | Rene Hidding (elected 2) | 7,608 | 11.8 | −2.3 | |
| Liberal | Mark Shelton (elected 3) | 5,263 | 8.2 | +8.2 | |
| Liberal | Jane Howlett | 4,497 | 7.0 | +2.5 | |
| Liberal | Jim Playsted | 4,027 | 6.2 | +6.2 | |
| Liberal | Leigh Gray | 1,867 | 2.9 | +2.9 | |
| Greens | Tim Morris (elected 1) | 9,108 | 14.1 | +3.6 | |
| Greens | Karen Cassidy | 1,593 | 2.5 | +1.0 | |
| Greens | Jackie Graham | 1,039 | 1.6 | +1.6 | |
| Greens | Karl Stevens | 1,013 | 1.6 | +1.6 | |
| Greens | Sharon Prior | 871 | 1.4 | +1.4 | |
| Total formal votes | 64,443 | 95.0 | −0.3 | ||
| Informal votes | 3,367 | 5.0 | +0.3 | ||
| Turnout | 67,810 | 93.7 | −1.4 | ||
| Party total votes | |||||
| Labor | 27,557 | 42.8 | −9.5 | ||
| Liberal | 23,262 | 36.1 | +6.1 | ||
| Greens | 13,624 | 21.1 | +5.8 | ||
Elections in the 2000s
2006
| Party | Candidate | Votes | % | ±% | |
|---|---|---|---|---|---|
| Quota | 10,020 | ||||
| Labor | Michael Polley (elected 1) | 12,741 | 21.2 | +5.9 | |
| Labor | David Llewellyn (elected 2) | 11,036 | 18.4 | −1.2 | |
| Labor | Heather Butler (elected 4) | 3,612 | 6.0 | +2.9 | |
| Labor | Kerry DeGrassi | 2,361 | 3.9 | +3.9 | |
| Labor | Malcolm Upston | 1,451 | 2.4 | +2.4 | |
| Liberal | Rene Hidding (elected 3) | 8,455 | 14.1 | +7.0 | |
| Liberal | Geoff Page | 3,757 | 6.2 | +6.2 | |
| Liberal | Jane Howlett | 2,733 | 4.5 | +4.5 | |
| Liberal | Richard Shoobridge | 1,601 | 2.7 | +2.7 | |
| Liberal | Andrew Wright | 1,465 | 2.4 | +2.4 | |
| Greens | Tim Morris (elected 5) | 6,326 | 10.5 | +1.4 | |
| Greens | Annie Willock | 901 | 1.5 | −0.9 | |
| Greens | Karen Cassidy | 897 | 1.5 | −0.8 | |
| Greens | Helen Gee | 885 | 1.5 | +1.5 | |
| Greens | Frederika Perey | 500 | 0.8 | +0.8 | |
| Tasmania First | Gordon Crawford | 866 | 1.4 | +1.4 | |
| Independent | Geoff Dickinson | 354 | 0.6 | +0.6 | |
| Independent | Geoff Wharton | 178 | 0.3 | +0.3 | |
| Total formal votes | 60,119 | 95.3 | +0.7 | ||
| Informal votes | 2,984 | 4.7 | −0.7 | ||
| Turnout | 63,103 | 95.1 | +1.3 | ||
| Party total votes | |||||
| Labor | 31,201 | 51.9 | −2.7 | ||
| Liberal | 18,011 | 29.9 | +4.2 | ||
| Greens | 9,509 | 15.8 | −1.3 | ||
| Tasmania First | 866 | 1.4 | +1.4 | ||
| Independent | Geoff Dickinson | 354 | 0.6 | +0.6 | |
| Independent | Geoff Wharton | 178 | 0.3 | +0.3 | |
2002
| Party | Candidate | Votes | % | ±% | |
|---|---|---|---|---|---|
| Quota | 9,385 | ||||
| Labor | David Llewellyn (elected 1) | 11,017 | 19.6 | +6.1 | |
| Labor | Michael Polley (elected 2) | 8,585 | 15.2 | +2.6 | |
| Labor | Ken Bacon (elected 4) | 8,073 | 14.3 | +4.2 | |
| Labor | Heather Butler | 1,745 | 3.1 | +3.1 | |
| Labor | Craig Farrell | 1,316 | 2.3 | +2.3 | |
| Liberal | Rene Hidding (elected 5) | 3,958 | 7.0 | −4.1 | |
| Liberal | Denise Swan | 3,905 | 6.9 | −0.2 | |
| Liberal | Russell Anderson | 3,520 | 6.3 | +6.3 | |
| Liberal | Stephen Wilson | 2,081 | 3.7 | +3.7 | |
| Liberal | Ray Williams | 1,019 | 1.8 | +1.8 | |
| Greens | Tim Morris (elected 3) | 5,150 | 9.1 | +9.1 | |
| Greens | Annie Willock | 1,335 | 2.4 | +2.4 | |
| Greens | Karen Cassidy | 1,284 | 2.3 | +2.3 | |
| Greens | Lesley Nicklason | 1,031 | 1.8 | +1.8 | |
| Greens | Delia Thompson | 859 | 1.5 | +1.5 | |
| Group C | John Gee | 427 | 0.8 | +0.8 | |
| Group C | Dennis Woods | 171 | 0.3 | +0.3 | |
| Group C | Andy Oliver | 133 | 0.2 | +0.2 | |
| Independent | Caroline Larner | 435 | 0.8 | +0.8 | |
| Group E | Frank Strie | 222 | 0.4 | +0.4 | |
| Group E | Ray Norman | 38 | 0.1 | +0.1 | |
| Total formal votes | 56,304 | 94.6 | −1.6 | ||
| Informal votes | 3,196 | 5.4 | +1.6 | ||
| Turnout | 59,500 | 93.8 | −1.7 | ||
| Party total votes | |||||
| Labor | 30,736 | 54.6 | +8.0 | ||
| Liberal | 14,483 | 25.7 | −7.7 | ||
| Greens | 9,659 | 17.2 | +7.1 | ||
| Group C | 731 | 1.3 | +1.3 | ||
| Independent | Caroline Larner | 435 | 0.8 | +0.8 | |
| Group E | 260 | 0.5 | +0.5 | ||
Elections in the 1990s
1998
| Party | Candidate | Votes | % | ±% | |
|---|---|---|---|---|---|
| Quota | 10,281 | ||||
| Labor | David Llewellyn (elected 2) | 8,304 | 13.5 | −2.4 | |
| Labor | Michael Polley (elected 3) | 7,756 | 12.6 | −0.5 | |
| Labor | Ken Bacon (elected 5) | 6,213 | 10.1 | +10.1 | |
| Labor | Lara Giddings | 4,945 | 8.0 | +4.5 | |
| Labor | Scott Wiggins | 1,070 | 1.7 | +1.7 | |
| Labor | Danial Rochford | 474 | 0.8 | +0.8 | |
| Liberal | Rene Hidding (elected 1) | 6,896 | 11.2 | +3.6 | |
| Liberal | Denise Swan (elected 4) | 4,387 | 7.2 | −0.9 | |
| Liberal | Bob Mainwaring | 4,000 | 6.5 | −2.3 | |
| Liberal | John Gee | 3,514 | 5.7 | +5.7 | |
| Liberal | Carmel Torenius | 1,778 | 2.9 | +2.9 | |
| Greens | Christine Milne | 5,507 | 8.9 | −0.8 | |
| Greens | Sonia Chirgwin | 235 | 0.4 | +0.4 | |
| Greens | Ted Field | 201 | 0.3 | +0.3 | |
| Greens | John Collins | 144 | 0.2 | +0.2 | |
| Greens | Neil Smith | 138 | 0.2 | +0.2 | |
| Tasmania First | Dave Pickford | 2,036 | 3.3 | +3.3 | |
| Tasmania First | Will Frank | 1,238 | 2.0 | +2.0 | |
| Tasmania First | Darryl Gerrity | 1,182 | 1.9 | +1.9 | |
| Tasmania First | M. Turner | 869 | 1.4 | +1.4 | |
| Tasmania First | Jack Kelly | 797 | 1.3 | +1.3 | |
| Total formal votes | 61,684 | 96.2 | +1.6 | ||
| Informal votes | 2,462 | 3.8 | −1.6 | ||
| Turnout | 64,146 | 95.5 | −0.8 | ||
| Party total votes | |||||
| Labor | 28,762 | 46.6 | +5.8 | ||
| Liberal | 20,575 | 33.4 | −8.2 | ||
| Greens | 6,225 | 10.1 | −1.3 | ||
| Tasmania First | 6,122 | 9.9 | +9.9 | ||
1996
| Party | Candidate | Votes | % | ±% | |
|---|---|---|---|---|---|
| Quota | 7,616 | ||||
| Liberal | Bob Mainwaring (elected 3) | 5,335 | 8.8 | +3.9 | |
| Liberal | Denise Swan (elected 7) | 4,926 | 8.1 | +4.4 | |
| Liberal | Rene Hidding (elected 6) | 4,626 | 7.6 | +7.6 | |
| Liberal | Graeme Page | 4,572 | 7.5 | +3.4 | |
| Liberal | Malcolm Cleland | 2,405 | 3.9 | −0.1 | |
| Liberal | His Grace the Most Noble Duke of Avram | 1,863 | 3.1 | +0.6 | |
| Liberal | Stephen Salter | 1,615 | 2.7 | +2.7 | |
| Labor | David Llewellyn (elected 1) | 9,817 | 16.1 | +6.0 | |
| Labor | Michael Polley (elected 2) | 7,981 | 13.1 | +2.7 | |
| Labor | Lara Giddings (elected 4) | 2,162 | 3.5 | +3.5 | |
| Labor | Dudley Parker | 1,468 | 2.4 | +2.4 | |
| Labor | Pat Tate | 1,249 | 2.1 | +1.0 | |
| Labor | Andrew MacGregor | 1,248 | 2.0 | +2.0 | |
| Labor | Martin Clifford | 927 | 1.5 | +1.5 | |
| Greens | Christine Milne (elected 5) | 5,917 | 9.7 | −0.5 | |
| Greens | Annie Willock | 207 | 0.3 | +0.3 | |
| Greens | Deborah Lynch | 195 | 0.3 | +0.3 | |
| Greens | Glenn Millar | 171 | 0.3 | +0.3 | |
| Greens | Laurie Goldsworthy | 168 | 0.3 | 0.0 | |
| Greens | Stuart Lennox | 152 | 0.2 | +0.2 | |
| Greens | Kim Imber | 131 | 0.2 | +0.2 | |
| National | Peter Murray | 806 | 1.3 | +1.3 | |
| National | David Tomkinson | 357 | 0.6 | +0.6 | |
| National | Paul Pinder | 222 | 0.4 | +0.4 | |
| National | Rick Wright | 204 | 0.3 | +0.3 | |
| National | Julia Gulson | 177 | 0.3 | +0.3 | |
| National | Christopher Parry | 137 | 0.2 | +0.2 | |
| Group C | Max Burr | 927 | 1.5 | +1.5 | |
| Group C | Paul Ashley | 45 | 0.1 | +0.1 | |
| Independent | Darryl Gerrity | 516 | 0.8 | +0.8 | |
| Extremely Greedy 40% | Annie Beecroft | 214 | 0.4 | +0.4 | |
| Extremely Greedy 40% | Andrea Long | 185 | 0.3 | +0.3 | |
| Total formal votes | 60,925 | 94.6 | −0.7 | ||
| Informal votes | 3,458 | 5.4 | +0.7 | ||
| Turnout | 64,383 | 96.3 | +1.1 | ||
| Party total votes | |||||
| Liberal | 25,342 | 41.6 | −16.3 | ||
| Labor | 24,852 | 40.8 | +13.9 | ||
| Greens | 6,941 | 11.4 | −0.9 | ||
| National | 1,903 | 3.1 | +3.1 | ||
| Group C | 972 | 1.6 | +1.6 | ||
| Independent | Darryl Gerrity | 516 | 0.8 | +0.8 | |
| Extremely Greedy 40% | 399 | 0.7 | +0.7 | ||
1992
| Party | Candidate | Votes | % | ±% | |
|---|---|---|---|---|---|
| Quota | 7,362 | ||||
| Liberal | Robin Gray (elected 1) | 18,751 | 31.8 | −3.9 | |
| Liberal | Ian Braid (elected 2) | 4,096 | 7.0 | +3.7 | |
| Liberal | Bob Mainwaring (elected 7) | 2,872 | 4.9 | +2.3 | |
| Liberal | Graeme Page (elected 6) | 2,386 | 4.0 | +1.7 | |
| Liberal | Malcolm Cleland | 2,369 | 4.0 | +4.0 | |
| Liberal | Denise Swan | 2,171 | 3.7 | +3.7 | |
| Liberal | The Duke of Avram | 1,483 | 2.5 | −0.9 | |
| Labor | Michael Polley (elected 5) | 6,123 | 10.4 | −0.3 | |
| Labor | David Llewellyn (elected 4) | 5,943 | 10.1 | +3.1 | |
| Labor | Chris Batt | 1,421 | 2.4 | −1.7 | |
| Labor | Peter Gilmore | 684 | 1.2 | +1.2 | |
| Labor | Pat Tate | 633 | 1.1 | +1.1 | |
| Labor | Eugene Alexander | 631 | 1.1 | +1.1 | |
| Labor | Brian Smith | 430 | 0.7 | +0.7 | |
| Independent Greens | Christine Milne (elected 3) | 6,025 | 10.2 | −6.0 | |
| Independent Greens | Diane Masters | 501 | 0.9 | +0.5 | |
| Independent Greens | Noel Harper | 221 | 0.4 | +0.4 | |
| Independent Greens | Laurie Goldsworthy | 180 | 0.3 | 0.0 | |
| Independent Greens | Tess Schramm | 111 | 0.2 | +0.2 | |
| Independent Greens | Jeremy Pearce | 107 | 0.2 | +0.2 | |
| Independent Greens | Phil Forward | 84 | 0.1 | +0.1 | |
| Advance Tasmania | Dudley Parker | 500 | 0.8 | +0.8 | |
| Advance Tasmania | Simon Edmunds | 349 | 0.6 | +0.6 | |
| Advance Tasmania | Bill Chugg | 195 | 0.3 | +0.3 | |
| Advance Tasmania | Les Whittle | 152 | 0.3 | +0.3 | |
| Independent | Ian Jamieson | 299 | 0.5 | +0.5 | |
| Independent | John Davidson | 176 | 0.3 | +0.3 | |
| Total formal votes | 58,893 | 95.3 | +1.0 | ||
| Informal votes | 2,911 | 4.7 | −1.0 | ||
| Turnout | 61,804 | 95.2 | +1.3 | ||
| Party total votes | |||||
| Liberal | 34,128 | 57.9 | +6.5 | ||
| Labor | 15,865 | 26.9 | −4.1 | ||
| Independent Greens | 7,229 | 12.3 | −4.5 | ||
| Advance Tasmania | 1,196 | 2.0 | +2.0 | ||
| Independent | Ian Jamieson | 299 | 0.5 | +0.5 | |
| Independent | John Davidson | 176 | 0.3 | +0.3 | |
Elections in the 1980s
1989
| Party | Candidate | Votes | % | ±% | |
|---|---|---|---|---|---|
| Quota | 6,857 | ||||
| Liberal | Robin Gray (elected 1) | 19,585 | 35.7 | −6.5 | |
| Liberal | The Duke of Avram (elected 6) | 1,881 | 3.4 | +3.4 | |
| Liberal | Ian Braid (elected 4) | 1,792 | 3.3 | −0.8 | |
| Liberal | Bob Mainwaring | 1,435 | 2.6 | −0.3 | |
| Liberal | Graeme Page (elected 5) | 1,258 | 2.3 | −0.6 | |
| Liberal | Ron Limb | 1,158 | 2.1 | +2.1 | |
| Liberal | Stephen Salter | 1,092 | 2.0 | −1.1 | |
| Labor | Michael Polley (elected 3) | 5,874 | 10.7 | −2.0 | |
| Labor | David Llewellyn (elected 7) | 3,856 | 7.0 | −2.2 | |
| Labor | Terry Field | 2,990 | 5.5 | +5.5 | |
| Labor | Chris Batt | 2,246 | 4.1 | +0.9 | |
| Labor | Wendy Carnicelli | 1,010 | 1.8 | +1.8 | |
| Labor | Gary Whitney | 700 | 1.3 | +1.3 | |
| Labor | Carole Coppleman | 348 | 0.6 | +0.6 | |
| Independent Greens | Christine Milne (elected 2) | 8,868 | 16.2 | +16.2 | |
| Independent Greens | Diane Masters | 209 | 0.4 | +0.4 | |
| Independent Greens | Laurie Goldsworthy | 150 | 0.3 | +0.3 | |
| Democrats | Liz Holloway | 202 | 0.4 | +0.4 | |
| Democrats | Sarah Hancock | 201 | 0.4 | +0.4 | |
| Total formal votes | 54,855 | 94.3 | +0.3 | ||
| Informal votes | 3,310 | 5.7 | −0.3 | ||
| Turnout | 58,165 | 93.9 | −0.3 | ||
| Party total votes | |||||
| Liberal | 28,201 | 51.4 | −8.0 | ||
| Labor | 17,024 | 31.0 | −5.9 | ||
| Independent Greens | 9,227 | 16.8 | +16.8 | ||
| Democrats | 403 | 0.7 | +0.7 | ||
1986
| Party | Candidate | Votes | % | ±% | |
|---|---|---|---|---|---|
| Quota | 6,400 | ||||
| Liberal | Robin Gray (elected 1) | 21,615 | 42.2 | +10.0 | |
| Liberal | Ian Braid (elected 3) | 2,097 | 4.1 | −3.7 | |
| Liberal | Stephen Salter | 1,573 | 3.1 | +1.1 | |
| Liberal | Bob Mainwaring (elected 7) | 1,496 | 2.9 | +2.9 | |
| Liberal | Graeme Page (elected 6) | 1,484 | 2.9 | −0.9 | |
| Liberal | Helen Brock | 1,277 | 2.5 | +2.5 | |
| Liberal | Jim Hay | 890 | 1.7 | +1.7 | |
| Labor | Michael Polley (elected 2) | 6,480 | 12.7 | +0.8 | |
| Labor | David Llewellyn (elected 4) | 4,700 | 9.2 | +9.2 | |
| Labor | Darrel Baldock (elected 5) | 2,935 | 5.7 | −5.7 | |
| Labor | Chris Batt | 1,635 | 3.2 | +0.9 | |
| Labor | Andrew Lohrey | 1,273 | 2.5 | −2.9 | |
| Labor | Lynden Leppard | 960 | 1.9 | +1.9 | |
| Labor | Fritz Robinson | 932 | 1.8 | +1.8 | |
| Independent | Bill Chugg | 1,850 | 3.6 | +3.6 | |
| Total formal votes | 51,197 | 94.0 | −0.2 | ||
| Informal votes | 3,262 | 6.0 | +0.2 | ||
| Turnout | 54,459 | 94.2 | 0.0 | ||
| Party total votes | |||||
| Liberal | 30,432 | 59.4 | +8.6 | ||
| Labor | 18,915 | 36.9 | −4.9 | ||
| Independent | Bill Chugg | 1,850 | 3.6 | +3.6 | |
1982
| Party | Candidate | Votes | % | ±% | |
|---|---|---|---|---|---|
| Quota | 6,289 | ||||
| Liberal | Robin Gray (elected 1) | 16,233 | 32.3 | +10.1 | |
| Liberal | Ian Braid (elected 2) | 3,935 | 7.8 | −0.9 | |
| Liberal | Graeme Page (elected 5) | 1,935 | 3.8 | −0.8 | |
| Liberal | Bruce Stewart | 1,140 | 2.3 | +2.3 | |
| Liberal | Stephen Salter (elected 6) | 1,031 | 2.0 | +1.2 | |
| Liberal | Edyth Langham | 719 | 1.4 | +1.4 | |
| Liberal | Kim Oswin | 564 | 1.1 | +1.1 | |
| Labor | Michael Polley (elected 4) | 5,996 | 11.9 | −3.0 | |
| Labor | Darrel Baldock (elected 3) | 5,751 | 11.4 | −1.6 | |
| Labor | Terry Aulich | 3,619 | 7.2 | −0.5 | |
| Labor | Andrew Lohrey (elected 7) | 2,723 | 5.4 | −6.4 | |
| Labor | Chris Batt | 1,168 | 2.3 | +2.3 | |
| Labor | Marguerite Scott | 674 | 1.3 | +1.3 | |
| Labor | Ken Smith | 564 | 1.1 | −0.4 | |
| Labor | Tony Beckerath | 527 | 1.0 | +1.0 | |
| Democrats | Liz Holloway | 1,058 | 2.1 | +2.1 | |
| Democrats | Nigel Burch | 762 | 1.5 | +1.5 | |
| Group C | Jeff Weston | 729 | 1.4 | +1.4 | |
| Group C | John Reed | 379 | 0.8 | +0.8 | |
| Independent | Gregory Suitor | 324 | 0.6 | +0.6 | |
| Independent | Len De Kok | 196 | 0.4 | +0.4 | |
| Independent | Adrian Brettingham-Moore | 192 | 0.4 | +0.4 | |
| Independent | John Clune | 90 | 0.2 | +0.2 | |
| Total formal votes | 50,309 | 94.2 | −1.6 | ||
| Informal votes | 3,085 | 5.8 | +1.6 | ||
| Turnout | 53,394 | 94.2 | −0.4 | ||
| Party total votes | |||||
| Liberal | 25,557 | 50.8 | +7.3 | ||
| Labor | 21,022 | 41.8 | −13.8 | ||
| Democrats | 1,820 | 3.6 | +3.6 | ||
| Group C | 1,108 | 2.2 | +2.2 | ||
| Independent | Gregory Suitor | 324 | 0.6 | +0.6 | |
| Independent | Len De Kok | 196 | 0.4 | +0.4 | |
| Independent | Adrian Brettingham-Moore | 192 | 0.4 | +0.4 | |
| Independent | John Clune | 90 | 0.2 | +0.2 | |
Elections in the 1970s
1979
| Party | Candidate | Votes | % | ±% | |
|---|---|---|---|---|---|
| Labor | Michael Polley (elected 2) | 7,090 | 14.9 | −2.0 | |
| Labor | Darrel Baldock (elected 3) | 6,183 | 13.0 | −0.2 | |
| Labor | Andrew Lohrey (elected 4) | 5,642 | 11.8 | +4.0 | |
| Labor | Terry Aulich (elected 7) | 3,690 | 7.7 | +4.6 | |
| Labor | Geoffrey Woods | 2,051 | 4.3 | +4.3 | |
| Labor | Brian Smith | 1,180 | 2.5 | +2.5 | |
| Labor | Ken Smith | 717 | 1.5 | +1.5 | |
| Liberal | Robin Gray (elected 1) | 10,615 | 22.2 | +12.5 | |
| Liberal | Ian Braid (elected 5) | 4,173 | 8.7 | +0.5 | |
| Liberal | Graeme Page (elected 6) | 2,192 | 4.6 | −1.1 | |
| Liberal | Geoff Squibb | 1,548 | 3.2 | +3.2 | |
| Liberal | Margaret Peacock | 1,387 | 2.9 | +2.9 | |
| Liberal | David Rubock | 449 | 0.9 | +0.9 | |
| Liberal | Stephen Salter | 382 | 0.8 | +0.8 | |
| Independent | Fred Woods | 437 | 0.9 | +0.9 | |
| Total formal votes | 47,736 | 95.8 | −0.3 | ||
| Informal votes | 2,067 | 4.2 | +0.3 | ||
| Turnout | 49,803 | 94.6 | −1.1 | ||
| Party total votes | |||||
| Labor | 26,553 | 55.6 | +2.5 | ||
| Liberal | 20,746 | 43.5 | −1.5 | ||
| Independent | Fred Woods | 437 | 0.9 | +0.9 | |
1976
| Party | Candidate | Votes | % | ±% | |
|---|---|---|---|---|---|
| Quota | 5,948 | ||||
| Labor | Michael Polley (elected 1) | 8,055 | 16.9 | +5.7 | |
| Labor | Darrel Baldock (elected 2) | 6,265 | 13.2 | +6.0 | |
| Labor | Andrew Lohrey (elected 4) | 3,704 | 7.8 | −2.2 | |
| Labor | Charles Batt | 3,094 | 6.5 | +0.4 | |
| Labor | Gordon Edhouse | 1,573 | 3.3 | +3.3 | |
| Labor | Terry Aulich (elected 5) | 1,483 | 3.1 | +3.1 | |
| Labor | Graham Vertigan | 578 | 1.2 | +1.2 | |
| Labor | Allan Rhodes | 521 | 1.0 | +1.0 | |
| Liberal | Robin Gray (elected 3) | 4,632 | 9.7 | +9.7 | |
| Liberal | Ian Braid (elected 6) | 3,891 | 8.2 | +1.8 | |
| Liberal | Graeme Page (elected 7) | 2,694 | 5.7 | +5.7 | |
| Liberal | Trevor Roach | 2,231 | 4.7 | +4.7 | |
| Liberal | Bob Ingamells | 2,207 | 4.6 | −0.6 | |
| Liberal | D L Youd | 1,971 | 4.1 | +4.1 | |
| Liberal | Jim Burn | 1,649 | 3.5 | +3.5 | |
| Liberal | Bert Bessell | 1,306 | 2.7 | −1.7 | |
| Liberal | Clyde FitzGerald | 1,029 | 2.2 | +2.2 | |
| United Tasmania | Anthony Burke | 343 | 0.7 | +0.7 | |
| United Tasmania | Anthony Joyce | 63 | 0.1 | +0.1 | |
| United Tasmania | Roy Jackson | 49 | 0.1 | +0.1 | |
| Workers | Stewart Lester | 253 | 0.5 | +0.5 | |
| Workers | Kevin Chaffey | 46 | 0.1 | +0.1 | |
| Independent | Stan King | 125 | 0.3 | +0.3 | |
| Total formal votes | 47,582 | 96.1 | −0.3 | ||
| Informal votes | 1,946 | 3.9 | +0.3 | ||
| Turnout | 49,528 | 95.7 | 0.0 | ||
| Party total votes | |||||
| Labor | 25,273 | 53.1 | −3.9 | ||
| Liberal | 21,430 | 45.0 | +2.9 | ||
| United Tasmania | 455 | 1.0 | +1.0 | ||
| Workers | 299 | 0.6 | +0.6 | ||
| Independent | Stan King | 125 | 0.3 | +0.3 | |
1972
| Party | Candidate | Votes | % | ±% | |
|---|---|---|---|---|---|
| Quota | 4,978 | ||||
| Labor | Michael Polley (elected 3) | 4,456 | 11.2 | +11.2 | |
| Labor | Andrew Lohrey (elected 4) | 3,992 | 10.0 | +10.0 | |
| Labor | Roy Fagan (elected 2) | 3,543 | 8.9 | −3.9 | |
| Labor | Darrel Baldock (elected 5) | 2,859 | 7.2 | +7.2 | |
| Labor | William Anderson | 2,543 | 6.4 | −2.2 | |
| Labor | Charles Batt | 2,422 | 6.1 | +6.1 | |
| Labor | Douglas Cashion | 2,384 | 6.0 | −3.0 | |
| Labor | Peter Lawson | 482 | 1.2 | +1.2 | |
| Liberal | Angus Bethune (elected 1) | 6,092 | 15.3 | −1.9 | |
| Liberal | Ian Braid | 2,537 | 6.4 | +2.8 | |
| Liberal | Bob Ingamells (elected 6) | 2,077 | 5.2 | −5.2 | |
| Liberal | Reginald Chopping | 1,921 | 4.8 | +4.8 | |
| Liberal | Bert Bessell (elected 7) | 1,754 | 4.4 | −5.0 | |
| Liberal | Donald Paterson | 1,292 | 3.2 | +3.2 | |
| Liberal | Peter Patmore | 757 | 1.9 | +1.9 | |
| Liberal | Donald Smith | 323 | 0.8 | +0.8 | |
| Group B | Bruce Hill | 314 | 0.8 | +0.8 | |
| Group B | Norman Murfet | 71 | 0.2 | +0.2 | |
| Total formal votes | 39,819 | 96.4 | +1.3 | ||
| Informal votes | 1,480 | 3.6 | −1.3 | ||
| Turnout | 41,299 | 95.7 | +0.3 | ||
| Party total votes | |||||
| Labor | 22,681 | 57.0 | +10.5 | ||
| Liberal | 16,753 | 42.1 | −5.9 | ||
| Group B | 385 | 1.0 | +1.0 | ||
References
- ^ "2025 Results for Lyons". Tasmanian Electoral Commission. Retrieved 30 July 2025.
- ^ "2024 Results for Lyons". Tasmanian Electoral Commission. Retrieved 3 April 2024.
- ^ "2021 Results for Lyons". Tasmanian Electoral Commission. Retrieved 11 May 2021.
- ^ "2018 Results for Lyons". Tasmanian Electoral Commission. Retrieved 2 April 2014.
- ^ "2014 Results for Lyons". Tasmanian Electoral Commission. Retrieved 2 April 2014.
- ^ "Lyons 2010 Results". Tasmanian Parliamentary Library.
- ^ "Lyons 2006 Results". Tasmanian Parliamentary Library.
- ^ "2002 Results for Lyons". Tasmanian Parliamentary Library.
- ^ "1998 Results for Lyons". Tasmanian Parliamentary Library.
- ^ "1996 Results for Lyons". Tasmanian Parliamentary Library.
- ^ "1992 results for Lyons". Tasmanian Parliamentary Library.
- ^ "1989 Results for Lyons". Tasmanian Parliamentary Library.
- ^ "1986 Results for Lyons". Tasmanian Parliamentary Library.
- ^ "1982 Results for Wilmot". Tasmanian Parliamentary Library.
- ^ "1979 Results for Wilmot". Tasmanian Parliamentary Library.