Busogo
Busogo | |
|---|---|
Town and sector | |
 Busogo Campus | |
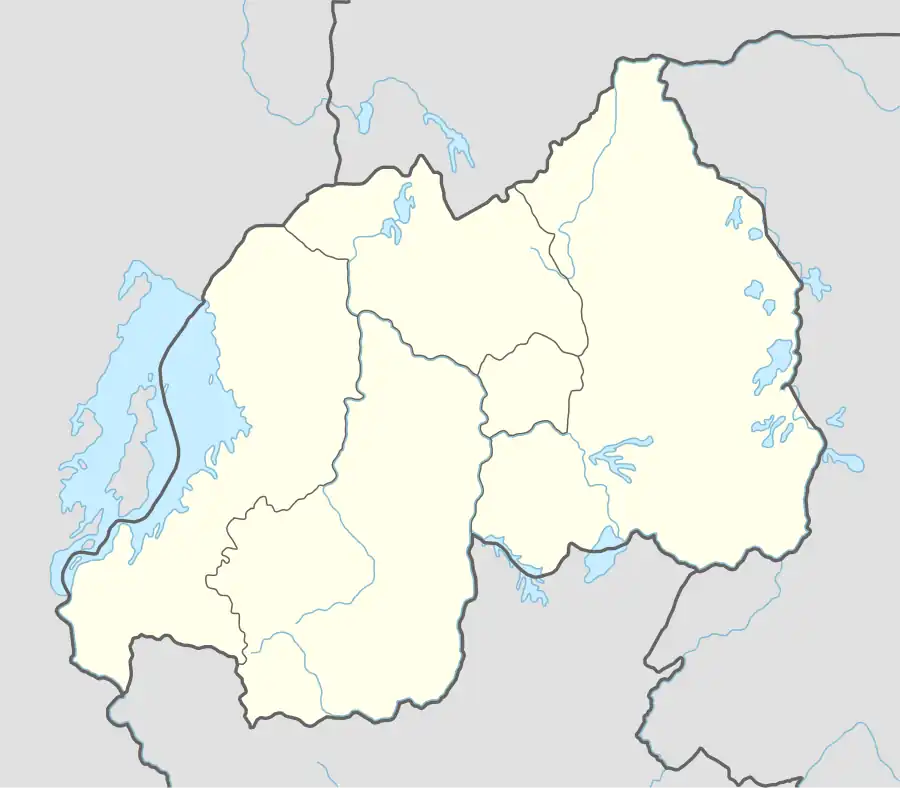 Busogo Location in Rwanda | |
| Coordinates: 1°33′26″S 29°32′39″E / 1.55722°S 29.54417°E | |
| Country | |
| Province | Northern Province |
| District | Musanze |
| Area | |
• Town and sector | 20.13 km2 (7.77 sq mi) |
| Population (2022 census)[1] | |
• Town and sector | 28,264 |
| • Density | 1,400/km2 (3,600/sq mi) |
| • Urban | 21,143 |
| Time zone | UTC+2 (CAT) |
Busogo is a town and sector of Musanze district, Northern Province, Rwanda.
Climate
| Climate data for Busogo (1991–2020) | |||||||||||||
|---|---|---|---|---|---|---|---|---|---|---|---|---|---|
| Month | Jan | Feb | Mar | Apr | May | Jun | Jul | Aug | Sep | Oct | Nov | Dec | Year |
| Record high °C (°F) | 28.3 (82.9) |
28.0 (82.4) |
27.1 (80.8) |
26.6 (79.9) |
25.3 (77.5) |
24.7 (76.5) |
25.0 (77.0) |
26.8 (80.2) |
27.3 (81.1) |
27.1 (80.8) |
26.6 (79.9) |
27.8 (82.0) |
28.3 (82.9) |
| Mean daily maximum °C (°F) | 22.1 (71.8) |
22.2 (72.0) |
21.7 (71.1) |
21.1 (70.0) |
20.1 (68.2) |
20.4 (68.7) |
19.9 (67.8) |
20.7 (69.3) |
21.1 (70.0) |
20.8 (69.4) |
21.4 (70.5) |
21.7 (71.1) |
21.1 (70.0) |
| Daily mean °C (°F) | 15.8 (60.4) |
16.0 (60.8) |
15.7 (60.3) |
15.9 (60.6) |
15.6 (60.1) |
15.2 (59.4) |
14.4 (57.9) |
15.2 (59.4) |
15.6 (60.1) |
15.6 (60.1) |
15.6 (60.1) |
15.8 (60.4) |
15.5 (59.9) |
| Mean daily minimum °C (°F) | 9.5 (49.1) |
9.9 (49.8) |
9.7 (49.5) |
10.7 (51.3) |
11.1 (52.0) |
10.0 (50.0) |
8.9 (48.0) |
9.6 (49.3) |
10.1 (50.2) |
10.3 (50.5) |
9.7 (49.5) |
10.0 (50.0) |
10.0 (50.0) |
| Record low °C (°F) | 5.0 (41.0) |
4.8 (40.6) |
5.0 (41.0) |
6.8 (44.2) |
6.7 (44.1) |
5.3 (41.5) |
3.5 (38.3) |
5.0 (41.0) |
5.5 (41.9) |
6.0 (42.8) |
3.9 (39.0) |
5.3 (41.5) |
3.5 (38.3) |
| Average precipitation mm (inches) | 121.1 (4.77) |
101.8 (4.01) |
160.8 (6.33) |
210.1 (8.27) |
141.4 (5.57) |
68.5 (2.70) |
12.5 (0.49) |
68.3 (2.69) |
126.9 (5.00) |
148.4 (5.84) |
196.3 (7.73) |
118.7 (4.67) |
1,474.7 (58.06) |
| Average precipitation days (≥ 1.0 mm) | 12.8 | 13.7 | 18.2 | 20.8 | 15.6 | 4.1 | 1.4 | 6.8 | 16.2 | 21.2 | 22.3 | 17.0 | 170.0 |
| Source: NOAA[2] | |||||||||||||
References
- ^ a b Citypopulation.de Population and area of busogo sector
- ^ "World Meteorological Organization Climate Normals for 1991-2020 — Busogo". National Oceanic and Atmospheric Administration. Retrieved June 16, 2024.