Ballon d'Alsace
| Ballon d'Alsace | |
|---|---|
 | |
| Highest point | |
| Elevation | 1,247 m (4,091 ft) |
| Prominence | 217 m (712 ft) |
| Isolation | 5.62 km (3.49 mi) |
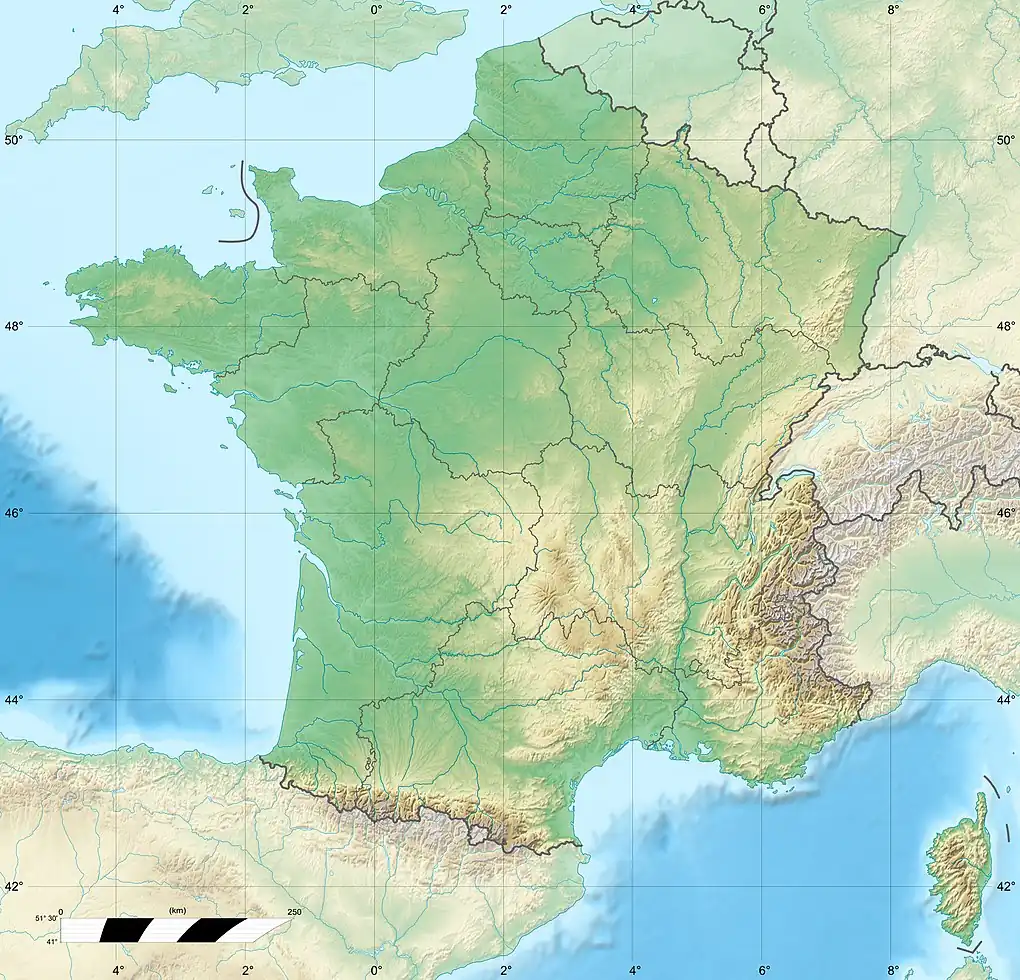
| Coordinates | 47°49′20″N 6°50′43″E / 47.82222°N 6.84528°E |
| Geography | |
 Ballon d'Alsace | |
| Parent range | Vosges |
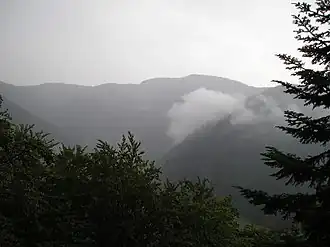
The Ballon d'Alsace (French pronunciation: [balɔ̃ dalzas]; German: Elsässer Belchen, pronounced [ˈɛlzɛsɐ ˈbɛlçn̩]) (el. 1247 m.), sometimes also called the Alsatian Belchen to distinguish it from other mountains named "Belchen")[1][2][3] is a mountain at the border of Alsace, Lorraine, and Franche-Comté. From its top, views include the Vosges, the Rhine valley, the Black Forest, and the Alps.
A road leads over a pass near the peak at the Col du Ballon d'Alsace, 1,171 m (3,842 ft). The pass is noted as the site of the first official mountain climb in the Tour de France on 11 July 1905,[4] the first rider to the top of the climb being René Pottier and the stage being won by Hippolyte Aucouturier. Stage 9 of the 2005 Tour crossed this pass on the centenary of the original climb.
Ballon d'Alsace features Alpine and Cross Country skiing tracks.
The mountain is part of the so-called Belchen system, a group of mountains with the name "Belchen" (in German) that may have been part of a Celtic sun calendar.
Geography
Climate
Ballon d'Alsace has a humid continental climate (Köppen climate classification Dfb). The average annual temperature in Ballon d'Alsace is 6.6 °C (43.9 °F). The average annual rainfall is 2,263.6 mm (89.12 in) with December as the wettest month. The temperatures are highest on average in July, at around 14.9 °C (58.8 °F), and lowest in January, at around −1.2 °C (29.8 °F). The highest temperature ever recorded in Ballon d'Alsace was 32.3 °C (90.1 °F) on 24 July 2019; the coldest temperature ever recorded was −19.1 °C (−2.4 °F) on 20 December 2009.
| Climate data for Ballon d'Alsace (1991–2020 averages, extremes 1987−present); elevation 1153m | |||||||||||||
|---|---|---|---|---|---|---|---|---|---|---|---|---|---|
| Month | Jan | Feb | Mar | Apr | May | Jun | Jul | Aug | Sep | Oct | Nov | Dec | Year |
| Record high °C (°F) | 14.3 (57.7) |
17.0 (62.6) |
18.4 (65.1) |
22.5 (72.5) |
26.4 (79.5) |
29.7 (85.5) |
32.3 (90.1) |
31.3 (88.3) |
26.3 (79.3) |
22.4 (72.3) |
18.5 (65.3) |
13.8 (56.8) |
32.3 (90.1) |
| Mean daily maximum °C (°F) | 1.1 (34.0) |
1.4 (34.5) |
4.7 (40.5) |
9.3 (48.7) |
13.4 (56.1) |
17.0 (62.6) |
18.6 (65.5) |
18.4 (65.1) |
14.3 (57.7) |
10.3 (50.5) |
5.1 (41.2) |
2.0 (35.6) |
9.6 (49.3) |
| Daily mean °C (°F) | −1.2 (29.8) |
−1.0 (30.2) |
1.9 (35.4) |
5.8 (42.4) |
9.6 (49.3) |
13.2 (55.8) |
14.9 (58.8) |
14.9 (58.8) |
11.1 (52.0) |
7.6 (45.7) |
2.8 (37.0) |
−0.2 (31.6) |
6.6 (43.9) |
| Mean daily minimum °C (°F) | −3.4 (25.9) |
−3.5 (25.7) |
−1.0 (30.2) |
2.4 (36.3) |
5.9 (42.6) |
9.4 (48.9) |
11.2 (52.2) |
11.3 (52.3) |
7.9 (46.2) |
4.9 (40.8) |
0.5 (32.9) |
−2.4 (27.7) |
3.6 (38.5) |
| Record low °C (°F) | −15.9 (3.4) |
−18.8 (−1.8) |
−15.7 (3.7) |
−9.3 (15.3) |
−3.6 (25.5) |
−0.9 (30.4) |
3.9 (39.0) |
2.5 (36.5) |
−0.2 (31.6) |
−7.7 (18.1) |
−13.8 (7.2) |
−19.1 (−2.4) |
−19.1 (−2.4) |
| Average precipitation mm (inches) | 251.9 (9.92) |
203.9 (8.03) |
196.5 (7.74) |
123.7 (4.87) |
178.8 (7.04) |
134.6 (5.30) |
148.8 (5.86) |
157.1 (6.19) |
154.0 (6.06) |
210.5 (8.29) |
215.2 (8.47) |
288.6 (11.36) |
2,263.6 (89.12) |
| Average precipitation days (≥ 1.0 mm) | 15.3 | 14.8 | 14.0 | 12.4 | 14.7 | 12.4 | 12.5 | 13.1 | 10.9 | 13.7 | 14.7 | 16.3 | 164.9 |
| Source: Météo-France[5] | |||||||||||||
| Climate data for Ballon De Servance, 1213m (1991–2020 normals) | |||||||||||||
|---|---|---|---|---|---|---|---|---|---|---|---|---|---|
| Month | Jan | Feb | Mar | Apr | May | Jun | Jul | Aug | Sep | Oct | Nov | Dec | Year |
| Record high °C (°F) | 13.4 (56.1) |
16.2 (61.2) |
18.0 (64.4) |
22.0 (71.6) |
25.4 (77.7) |
30.6 (87.1) |
31.2 (88.2) |
30.8 (87.4) |
25.8 (78.4) |
22.2 (72.0) |
18.1 (64.6) |
14.6 (58.3) |
31.2 (88.2) |
| Mean daily maximum °C (°F) | 0.7 (33.3) |
0.9 (33.6) |
4.3 (39.7) |
9.5 (49.1) |
12.4 (54.3) |
16.3 (61.3) |
18.5 (65.3) |
17.5 (63.5) |
14.4 (57.9) |
10.3 (50.5) |
5.2 (41.4) |
1.9 (35.4) |
9.3 (48.8) |
| Daily mean °C (°F) | −1.4 (29.5) |
−1.3 (29.7) |
1.6 (34.9) |
6.2 (43.2) |
9.0 (48.2) |
12.8 (55.0) |
14.9 (58.8) |
14.1 (57.4) |
11.2 (52.2) |
7.6 (45.7) |
3.0 (37.4) |
−0.2 (31.6) |
6.5 (43.6) |
| Mean daily minimum °C (°F) | −3.5 (25.7) |
−3.5 (25.7) |
−1.1 (30.0) |
2.9 (37.2) |
5.6 (42.1) |
9.4 (48.9) |
11.4 (52.5) |
10.7 (51.3) |
8.1 (46.6) |
5.0 (41.0) |
0.8 (33.4) |
−2.4 (27.7) |
3.6 (38.5) |
| Record low °C (°F) | −12.6 (9.3) |
−18.3 (−0.9) |
−12.8 (9.0) |
−9.2 (15.4) |
−4.1 (24.6) |
−0.9 (30.4) |
3.0 (37.4) |
2.2 (36.0) |
0.3 (32.5) |
−7.2 (19.0) |
−11.3 (11.7) |
−20.1 (−4.2) |
−20.1 (−4.2) |
| Average precipitation mm (inches) | 190.7 (7.51) |
141.0 (5.55) |
160.4 (6.31) |
94.1 (3.70) |
171.1 (6.74) |
137.1 (5.40) |
146.4 (5.76) |
148.7 (5.85) |
138.5 (5.45) |
161.6 (6.36) |
171.8 (6.76) |
221.5 (8.72) |
1,882.9 (74.11) |
| Source: Météo-France[6] | |||||||||||||
Gallery
-
 Statue of Jeanne d'Arc at Ballon d'Alsace
 -
 Deminers monument at Ballon d'Alsace
See also
References
- ^ Herbertson, Andrew John, A Handbook of Geography: Volume I. General Geography. The British Isles and Europe, London: T. Nelson (1912), p. 173.
- ^ Karfeld, Kurt, Peter; Walter Dirks and Manfred Hausmann, Germany in Colour, Karfeld Verlag, 1956, p. 16.
- ^ Schickele, Rene, Heart of Alsace, AA Knopf (1929), p. 164.
- ^ "L'HISTOIRE 1903-2008" (PDF) (in French). Archived from the original (pdf) on 5 June 2011. Retrieved 5 May 2011.
- ^ "Fiche Climatologique Statistiques 1991-2020 et records" (PDF). Météo-France. Retrieved August 21, 2022.
- ^ "Fiche Climatologique Statistiques 1991-2020 et records" (PDF) (in French). Météo-France. Retrieved September 3, 2023.
Further reading
- Bacon, Ellis (2014). Mapping Le Tour. Glasgow: HarperCollins Publishers. pp. 280–281. ISBN 9780007543991. OCLC 872700415.