2017 Caerphilly County Borough Council election|
|
|
|
|
First party
|
Second party
|
Third party
|
|
|
Lab
|
Pla
|
Ind
|
| Leader
|
David Poole
|
Colin Mann
|
N/A
|
| Party
|
Labour
|
Plaid Cymru
|
Independent
|
| Leader's seat
|
Pengam
|
Llanbradach
|
N/A
|
| Seats before
|
50
|
20
|
3
|
| Seats won
|
50
|
18
|
5
|
| Seat change
|
 0 0
|
 2 2
|
 2 2
|
| Popular vote
|
N/A
|
N/A
|
N/A
|
| Percentage
|
N/A
|
N/A
|
N/A
|
|
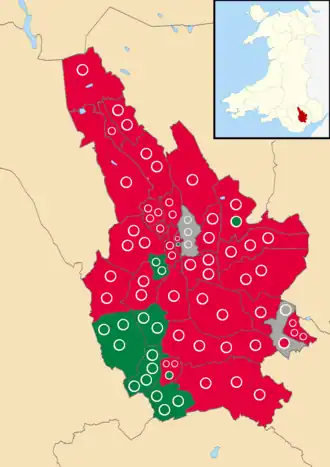 Map showing the results of the 2017 Caerphilly County Borough Council election. Red showing Welsh Labour, Green showing Plaid Cymru & grey showing independent candidates. |
|
The 2017 Caerphilly County Borough Council election was held on 4 May 2017 as part of the national 2017 Welsh local elections. The election was preceded by the 2012 CCBC election and was followed by the 2022 CCBC election.[1]
Overall results
Plaid Cymru had achieved tremendous growth in the 1999 Caerphilly County Borough Council election gaining a total of 38 seats, This tremendous growth had declined by the 2012 election to just 20 seats.[2] The Independents in Caerphilly County Borough had also suffered sizable losses in the 2012 election going from 9 in 2008 election to 3 in 2012 election.[2]
The Labour Party won 50 seats achieving a majority, Plaid Cymru obtained 18 seats and 5 seats were won by independent candidates. One seat (Twyn Carno ward) was elected unopposed.
2017 Caerphilly County Borough Council Election[3]
| Party
|
Seats
|
Gains
|
Losses
|
Net gain/loss
|
Seats %
|
Votes %
|
Votes
|
+/−
|
|
|
Labour
|
50
|
0
|
0
|
0
|
68.49
|
41.9
|
20,278
|
9.1
|
|
|
Plaid Cymru
|
18
|
0
|
2
|
2
|
24.65
|
33.9
|
16,423
|
4.1
|
|
|
Independent
|
5
|
2
|
0
|
2
|
6.84
|
8.8
|
4,237
|
5.9
|
|
|
Conservative
|
0
|
0
|
0
|
0
|
0.00
|
9.0
|
4,371
|
5.1
|
|
|
UKIP
|
0
|
0
|
0
|
0
|
0.00
|
3.4
|
1,670
|
New
|
|
|
Liberal Democrats
|
0
|
0
|
0
|
0
|
0.00
|
1.5
|
707
|
1.2
|
|
|
CPA
|
0
|
0
|
0
|
0
|
0.00
|
0.8
|
374
|
New
|
|
|
Green
|
0
|
0
|
0
|
0
|
0.00
|
0.5
|
257
|
New
|
|
|
TUSC
|
0
|
0
|
0
|
0
|
0.00
|
0.2
|
101
|
0.2
|
| Total
|
73
|
0
|
0
|
0
|
100.0
|
100.0
|
48,418
|
0.0
|
Ward results
Cwm Aber / Aber Valley
Aberbargod / Aberbargoed
Electorate: 2593, Turnout: 30.85%
| Candidate
|
Party
|
Votes
|
%
|
Notes
|
| Alan Gerald Higgs |
Welsh Labour |
362 |
24.88% |
Elected
|
| Alan George Collis |
Welsh Labour |
352 |
24.19% |
Elected
|
| Lowri Cerys Edwards |
Plaid Cymru |
320 |
21.99% |
|
| Ted Edwards |
Plaid Cymru |
300 |
20.62% |
|
| Keith Mills |
UKIP |
121 |
8.32% |
|
Abercarn
Argoed
Electorate: 2018, Turnout: 36.77%
| Candidate
|
Party
|
Votes
|
%
|
Notes
|
| Walter Henry Edgar Williams |
Welsh Labour |
427 |
57.78% |
Elected
|
| John Moore |
UKIP |
168 |
22.73% |
|
| Roger John Moore |
Plaid Cymru |
144 |
19.49% |
|
Bargod / Bargoed
Electorate: 4383, Turnout: 30.76%
| Candidate
|
Party
|
Votes
|
%
|
Notes
|
| Tudor Davies |
Welsh Labour |
692 |
19.59% |
Elected
|
| Dianne Price |
Welsh Labour |
616 |
17.44% |
Elected
|
| Carol Julia Andrews |
Welsh Labour |
582 |
16.47% |
Elected
|
| Kevin Philip Viney |
Plaid Cymru |
423 |
11.97% |
|
| Gill Jones |
Plaid Cymru |
409 |
11.58% |
|
| James Kerby |
Independent |
322 |
9.11% |
|
| Andrew Thomas Nutt |
Plaid Cymru |
317 |
8.97% |
|
| Belinda Gingell |
Independent |
172 |
4.87% |
|
Bedwas, Trethomas and Machen
Coed Duon / Blackwood
Electorate: 6178, Turnout: 38.02%
| Candidate
|
Party
|
Votes
|
%
|
Notes
|
| Kevin Etheridge |
Independent |
1,069 |
16.52% |
Elected
|
| Nigel Stuart Dix |
Independent |
791 |
12.23% |
Elected
|
| Andrew David Farina-Childs |
Independent |
625 |
9.66% |
Elected
|
| Keith Smallman |
Independent |
618 |
9.55% |
|
| Patricia Cook |
Welsh Labour |
604 |
9.34% |
|
| Janet Griffiths |
Welsh Labour |
530 |
8.19% |
|
| Matthew Sessions |
Welsh Labour |
476 |
7.36% |
|
| Allan Rees |
Independent |
427 |
6.60% |
|
| Darren Jones |
Plaid Cymru |
377 |
5.83% |
|
| Andrew Short |
Plaid Cymru |
355 |
5.49% |
|
| Steven Anthony Blakeman |
Plaid Cymru |
320 |
4.95% |
|
| Paul Taylor |
UKIP |
278 |
4.30% |
|
Cefn Fforest
Electorate: 2841, Turnout: 35.13%
| Candidate
|
Party
|
Votes
|
%
|
Notes
|
| Tom Williams |
Welsh Labour |
453 |
25.69% |
Elected
|
| Graham Derek Simmonds |
Independent |
450 |
25.52% |
Elected
|
| Christopher Hawker |
Welsh Labour |
437 |
24.79% |
|
| Louise Rachael Phillips |
Independent |
423 |
23.99% |
|
Crosskeys
Electorate: 2436, Turnout: 35.47%
| Candidate
|
Party
|
Votes
|
%
|
Notes
|
| Julian Simmonds |
Welsh Labour |
450 |
53.44% |
Elected
|
| Christopher Phillip Norman Cook |
Plaid Cymru |
392 |
46.56% |
|
Crymlyn / Crumlin
Electorate: 4319, Turnout: 39.06%
| Candidate
|
Party
|
Votes
|
%
|
Notes
|
| Carl Jeffrey Thomas |
Welsh Labour |
701 |
23.62% |
Elected
|
| Mike Davies |
Plaid Cymru |
619 |
20.86% |
Elected
|
| Andrew Lewis |
Welsh Labour |
612 |
20.62% |
|
| Alwyn Lewis Lloyd |
Plaid Cymru |
504 |
16.98% |
|
| Philip Fowler |
Independent |
281 |
9.47% |
|
| Dominic Walker |
Independent |
251 |
8.46% |
|
Cwm Darran / Darren Valley
Electorate: 1803, Turnout: 33.11%
| Candidate
|
Party
|
Votes
|
%
|
Notes
|
| David Thomas Hardacre |
Welsh Labour |
349 |
59.05% |
Elected
|
| Keiron David O'Hagan |
Independent |
242 |
40.95% |
|
Gilfach
Hengoed
Electorate: 3897, Turnout: 33.95%
| Candidate
|
Party
|
Votes
|
%
|
Notes
|
| Donna Cushing |
Plaid Cymru |
678 |
31.83% |
Elected
|
| Teresa Elizabeth Parry |
Plaid Cymru |
676 |
31.74% |
Elected
|
| Mark Anthony Boyland |
Welsh Labour |
478 |
22.44% |
|
| Graham George Wills |
UKIP |
298 |
13.99% |
|
Llanbradach
Electorate: 3197, Turnout: 40.29%
| Candidate
|
Party
|
Votes
|
%
|
Notes
|
| Robert William Gough |
Plaid Cymru |
870 |
37.05% |
Elected
|
| Colin Peter Mann |
Plaid Cymru |
834 |
35.52% |
Elected
|
| Rhydian Dafydd Birkinshaw |
Welsh Labour |
324 |
13.80% |
|
| Bethan Louise Thomas |
Welsh Labour |
320 |
13.63% |
|
Maesycwmmer
Morgan Jones
Moria / Moriah
Electorate: 3128, Turnout: 31.71%
| Candidate
|
Party
|
Votes
|
%
|
Notes
|
| John Bevan |
Welsh Labour |
565 |
36.83% |
Elected
|
| Dai Harse |
Welsh Labour |
538 |
35.07% |
Elected
|
| Nathan Thomas Flanagan |
Plaid Cymru |
431 |
28.10% |
|
Nelson
Tredegar Newydd / New Tredegar
Electorate: 3343, Turnout: 31.41%
| Candidate
|
Party
|
Votes
|
%
|
Notes
|
| Eluned Stenner |
Welsh Labour |
687 |
36.78% |
Elected
|
| Mark Anthony Evans |
Welsh Labour |
665 |
35.60% |
Elected
|
| Kev Rodgers |
Independent |
257 |
13.76% |
|
| Rachael Joanne Dixon |
Plaid Cymru |
137 |
7.33% |
|
| Bethany Adele Edwards |
Plaid Cymru |
122 |
6.53% |
|
Trecelyn / Newbridge
Pengam
Electorate: 2702, Turnout: 33.16%
| Candidate
|
Party
|
Votes
|
%
|
Notes
|
| David Vincent Poole |
Welsh Labour |
507 |
32.11% |
Elected
|
| Kevin Dawson |
Welsh Labour |
505 |
31.98% |
Elected
|
| Noel Geoffrey Turner |
Plaid Cymru |
350 |
22.17% |
|
| Chris Paul |
Plaid Cymru |
217 |
13.74% |
|
Penmaen
Penyrheol
Pontllanfraith
Pontlotyn / Pontlottyn
Electorate: 1429, Turnout: 37.23%
| Candidate
|
Party
|
Votes
|
%
|
Notes
|
| Gaynor Denise Oliver |
Welsh Labour |
239 |
45.01% |
Elected
|
| Mervyn Dorian Diggle |
Independent |
235 |
44.26% |
|
| David Adam Rees |
Plaid Cymru |
57 |
10.73% |
|
Dwyrain Rhisga / Risca East
Gorllewin Rhisga / Risca West
Catwg Sant / St. Cattwg
Sant Iago / St. James
Martin Sant / St. Martins
Twyn Carno
Electorate: 1665
| Candidate
|
Party
|
Votes
|
%
|
Notes
|
| Carl Cuss |
Welsh Labour |
Unopposed |
– |
Elected
|
Ynysddu
Electorate: 2914, Turnout: 34.21%
| Candidate
|
Party
|
Votes
|
%
|
Notes
|
| Phillippa Marsden |
Welsh Labour |
720 |
39.37% |
Elected
|
| John Philip Ridgewell |
Welsh Labour |
638 |
34.88% |
Elected
|
| Lyn Ackerman |
Plaid Cymru |
244 |
13.34% |
|
| Terry Birkett |
Plaid Cymru |
227 |
12.41% |
|
Ystrad Mynach
Electorate: 3979, Turnout: 39.31%
| Candidate
|
Party
|
Votes
|
%
|
Notes
|
| Martyn Paul James |
Plaid Cymru |
919 |
33.49% |
Elected
|
| Alan Patrick Angel |
Plaid Cymru |
885 |
32.25% |
Elected
|
| Kerry Jones |
Welsh Labour |
505 |
18.40% |
|
| Alan Dowler |
Welsh Labour |
435 |
15.85% |
|
References