2011 Wirral Metropolitan Borough Council election
| |||||||||||||||||||||||||||||||||||||||||||||||||||||
23 of 66 seats (One Third and one by-election) to Wirral Metropolitan Borough Council 34 seats needed for a majority | |||||||||||||||||||||||||||||||||||||||||||||||||||||
|---|---|---|---|---|---|---|---|---|---|---|---|---|---|---|---|---|---|---|---|---|---|---|---|---|---|---|---|---|---|---|---|---|---|---|---|---|---|---|---|---|---|---|---|---|---|---|---|---|---|---|---|---|---|
| Turnout | 43.2% ( | ||||||||||||||||||||||||||||||||||||||||||||||||||||
| |||||||||||||||||||||||||||||||||||||||||||||||||||||
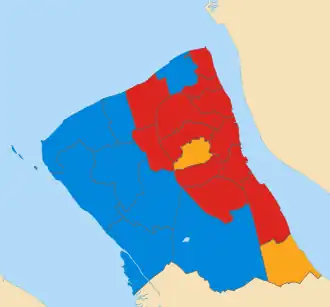 Map of results of 2011 election | |||||||||||||||||||||||||||||||||||||||||||||||||||||
| |||||||||||||||||||||||||||||||||||||||||||||||||||||
The 2011 Wirral Metropolitan Borough Council election took place on 5 May 2011 to elect members of Wirral Metropolitan Borough Council in England.[1] This election was held on the same day as other local elections.
After the election, the composition of the council was:
| Party | Seats | ± | |
|---|---|---|---|
| Labour | 29 | ||
| Conservative | 27 | ||
| Liberal Democrat | 10 | ||
Election results
Overall election result
Overall result compared with 2010.
| Wirral Metropolitan Borough Council election result, 2011 | |||||||||||||||
|---|---|---|---|---|---|---|---|---|---|---|---|---|---|---|---|
| Party | Candidates | Votes | |||||||||||||
| Stood | Elected | Gained | Unseated | Net | % of total | % | No. | Net % | |||||||
| Labour | 23 | 12 | 5 | 0 | 54.5 | 43.8 | 45,006 | ||||||||
| Conservative | 23 | 9 | 3 | 3 | 36.4 | 33.8 | 34,738 | ||||||||
| Liberal Democrats | 22 | 2 | 0 | 5 | 9.1 | 12.5 | 12,815 | ||||||||
| UKIP | 23 | 0 | 0 | 0 | 0.0 | 5.0 | 5,165 | ||||||||
| Green | 20 | 0 | 0 | 0 | 0.0 | 4.8 | 4,904 | ||||||||
| Independent | 1 | 0 | 0 | 0 | 0.0 | 0.1 | 154 | N/A | |||||||
Changes in council composition
Prior to the election the composition of the council was:
| 24 | 27 | 14 | 1 |
| Lab | Con | LD | V |
After the election the composition of the council was:
| 29 | 27 | 10 |
| Lab | Con | LD |
Ward results
Results compared directly with the last local election in 2010.
Bebington
| Party | Candidate | Votes | % | ±% | |
|---|---|---|---|---|---|
| Labour | Jerry Williams | 3,200 | 56.7 | ||
| Conservative | Kevin Sharkey | 1,762 | 31.2 | ||
| UKIP | Hilary Jones | 466 | 8.3 | ||
| Green | Michael Harper | 212 | 3.8 | ||
| Majority | 1,438 | 25.5 | |||
| Registered electors | 11,756 | ||||
| Turnout | 48.2 | ||||
| Labour hold | Swing | ||||
Bidston and St James
| Party | Candidate | Votes | % | ±% | |
|---|---|---|---|---|---|
| Labour | Harry Smith | 2,259 | 79.4 | ||
| Conservative | Jerrold Vickers | 284 | 10.0 | ||
| Liberal Democrats | John Brace | 160 | 5.6 | ||
| UKIP | Helen Romnes | 142 | 5.0 | ||
| Majority | 1,975 | 69.4 | |||
| Registered electors | 9,781 | ||||
| Turnout | 29.3 | ||||
| Labour hold | Swing | ||||
Birkenhead and Tranmere
| Party | Candidate | Votes | % | ±% | |
|---|---|---|---|---|---|
| Labour | Phillip Davies | 1,750 | 53.9 | ||
| Green | Pat Cleary | 1,133 | 34.9 | ||
| Conservative | June Cowin | 148 | 4.6 | ||
| UKIP | David Martin | 120 | 3.7 | ||
| Liberal Democrats | Allan Brame | 95 | 3.0 | ||
| Majority | 617 | 19.0 | |||
| Registered electors | 9,807 | ||||
| Turnout | 33.2 | ||||
| Labour hold | Swing | ||||
Bromborough
| Party | Candidate | Votes | % | ±% | |
|---|---|---|---|---|---|
| Labour | Joe Walsh | 2,609 | 57.9 | ||
| Liberal Democrats | Robert Moon | 768 | 17.1 | ||
| Conservative | Kathryn Hodson | 742 | 16.5 | ||
| UKIP | Timothy Pass | 227 | 5.0 | New | |
| Green | Percy Hogg | 157 | 3.5 | ||
| Majority | 1,841 | 40.8 | |||
| Registered electors | 10,762 | ||||
| Turnout | 42.0 | ||||
| Labour gain from Liberal Democrats | Swing | ||||
Clatterbridge
| Party | Candidate | Votes | % | ±% | |
|---|---|---|---|---|---|
| Conservative | Adam Sykes | 2,688 | 46.7 | ||
| Labour | Audrey Moore | 1,798 | 31.2 | ||
| Liberal Democrats | Simon Thomson | 816 | 14.2 | ||
| UKIP | Philip Griffiths | 275 | 4.8 | ||
| Green | Jim McGinley | 182 | 3.2 | ||
| Majority | 890 | 15.5 | |||
| Registered electors | 11,611 | ||||
| Turnout | 49.9 | ||||
| Conservative gain from Liberal Democrats | Swing | ||||
Claughton
| Party | Candidate | Votes | % | ±% | |
|---|---|---|---|---|---|
| Labour | Stephen Foulkes | 2,613 | 60.3 | ||
| Conservative | Barbara Sinclair | 952 | 22.0 | ||
| Liberal Democrats | Roy Wood | 308 | 7.1 | ||
| UKIP | Bethan Williams | 265 | 6.1 | ||
| Green | Cathy Page | 197 | 4.5 | ||
| Majority | 1,661 | 38.3 | |||
| Registered electors | 11,272 | ||||
| Turnout | 38.7 | ||||
| Labour hold | Swing | ||||
Eastham
| Party | Candidate | Votes | % | ±% | |
|---|---|---|---|---|---|
| Liberal Democrats | Dave Mitchell | 2,091 | 43.6 | ||
| Labour | Robert Gregson | 1,648 | 34.4 | ||
| Conservative | Colin Hughes | 809 | 16.9 | ||
| UKIP | Laurence Jones | 244 | 5.1 | ||
| Majority | 443 | 9.2 | |||
| Registered electors | 10,977 | ||||
| Turnout | 43.9 | ||||
| Liberal Democrats hold | Swing | ||||
Greasby, Frankby and Irby
| Party | Candidate | Votes | % | ±% | |
|---|---|---|---|---|---|
| Conservative | Mike Hornby [n 2] | 2,409 | 38.8 | ||
| Conservative | Tony Cox [n 3] | 2,292 | – | – | |
| Liberal Democrats | Peter Reisdorf | 1,652 | 26.6 | ||
| Labour | Andrew Hollingworth | 1,483 | 23.9 | ||
| Liberal Democrats | Frank Doyle | 1,220 | – | – | |
| Labour | Lee Rushworth | 1,208 | – | – | |
| UKIP | Patricia Lamb | 331 | 5.3 | ||
| Green | Kathryn Peers | 327 | 5.3 | ||
| UKIP | Timothy Crooke | 246 | – | – | |
| Majority | 757 | 12.2 | |||
| Registered electors | 11,497 | ||||
| Turnout | 52.6 | ||||
| Conservative gain from Liberal Democrats | Swing | ||||
| Conservative gain from Liberal Democrats | Swing | – | |||
Heswall
| Party | Candidate | Votes | % | ±% | |
|---|---|---|---|---|---|
| Conservative | Andrew Hodson | 3,745 | 64.9 | ||
| Labour | Alan Hannaford | 1,065 | 18.4 | ||
| Liberal Democrats | David Tyrrell | 392 | 6.8 | ||
| UKIP | David Scott | 290 | 5.0 | ||
| Green | Barbara Burton | 281 | 4.9 | ||
| Majority | 2,680 | 46.5 | |||
| Registered electors | 10,965 | ||||
| Turnout | 52.9 | ||||
| Conservative hold | Swing | ||||
Hoylake and Meols
| Party | Candidate | Votes | % | ±% | |
|---|---|---|---|---|---|
| Conservative | Gerry Ellis | 2,866 | 56.9 | ||
| Labour | Sylvia Hodrien | 1,283 | 25.5 | ||
| Liberal Democrats | Jane Otterson | 402 | 8.0 | ||
| Green | Yvonne McGinley | 349 | 6.9 | ||
| UKIP | Frank Whitham | 141 | 2.8 | ||
| Majority | 1,583 | 31.4 | |||
| Registered electors | 10,397 | ||||
| Turnout | 48.8 | ||||
| Conservative hold | Swing | ||||
Leasowe and Moreton East
| Party | Candidate | Votes | % | ±% | |
|---|---|---|---|---|---|
| Labour | Ron Abbey | 2,442 | 55.4 | ||
| Conservative | Steven Smith | 1,564 | 35.5 | ||
| UKIP | Russell Jones | 149 | 3.4 | ||
| Green | Jackie Smith | 143 | 3.2 | ||
| Liberal Democrats | Gerald Hainsworth | 111 | 2.5 | ||
| Majority | 878 | 19.9 | |||
| Registered electors | 10,629 | ||||
| Turnout | 41.8 | ||||
| Labour hold | Swing | ||||
Liscard
| Party | Candidate | Votes | % | ±% | |
|---|---|---|---|---|---|
| Labour | Bernie Mooney | 2,523 | 54.1 | ||
| Conservative | Karen Hayes | 1,673 | 35.8 | ||
| UKIP | Lynda Williams | 204 | 4.4 | ||
| Green | Kenny Peers | 146 | 3.1 | ||
| Liberal Democrats | Daniel Clein | 121 | 2.6 | ||
| Majority | 850 | 18.3 | |||
| Registered electors | 11,082 | ||||
| Turnout | 42.3 | ||||
| Labour gain from Conservative | Swing | ||||
Moreton West and Saughall Massie
| Party | Candidate | Votes | % | ±% | |
|---|---|---|---|---|---|
| Conservative | Steve Williams | 2,246 | 50.5 | ||
| Labour | Karl Greaney | 1,768 | 39.7 | ||
| UKIP | Susan Whitham | 198 | 4.4 | ||
| Liberal Democrats | Eric Copestake | 144 | 3.2 | ||
| Green | Perle Sheldricks | 94 | 2.1 | ||
| Majority | 478 | 10.8 | |||
| Registered electors | 10,724 | ||||
| Turnout | 41.7 | ||||
| Conservative hold | Swing | ||||
New Brighton
| Party | Candidate | Votes | % | ±% | |
|---|---|---|---|---|---|
| Labour | Pat Hackett | 2,283 | 49.6 | ||
| Conservative | Tony Pritchard | 1,621 | 35.2 | ||
| Green | Cynthia Stonall | 264 | 5.7 | ||
| UKIP | Bill Duffey | 254 | 5.5 | ||
| Liberal Democrats | Julia Codling | 177 | 3.8 | ||
| Majority | 662 | 14.4 | |||
| Registered electors | 10,825 | ||||
| Turnout | 42.8 | ||||
| Labour gain from Conservative | Swing | ||||
Oxton
| Party | Candidate | Votes | % | ±% | |
|---|---|---|---|---|---|
| Liberal Democrats | Stuart Kelly | 1,918 | 39.8 | ||
| Labour | Matthew Patrick | 1,792 | 37.2 | ||
| Conservative | Tina McDonnell | 655 | 13.6 | ||
| UKIP | Catherine Williams | 234 | 4.9 | ||
| Green | Garnette Bowler | 222 | 4.6 | ||
| Majority | 126 | 2.6 | |||
| Registered electors | 11,108 | ||||
| Turnout | 43.6 | ||||
| Liberal Democrats hold | Swing | ||||
Pensby and Thingwall
| Party | Candidate | Votes | % | ±% | |
|---|---|---|---|---|---|
| Conservative | Don McCubbin | 1,881 | 36.9 | ||
| Labour | Michael Sullivan | 1,636 | 32.1 | ||
| Liberal Democrats | Damien Cummins | 1,209 | 23.7 | ||
| UKIP | Oliver Sayle-Adam | 196 | 3.8 | ||
| Green | Allen Burton | 180 | 3.5 | ||
| Majority | 245 | 4.8 | N/A | ||
| Registered electors | 10,493 | ||||
| Turnout | 48.8 | ||||
| Conservative hold | Swing | ||||
Prenton
| Party | Candidate | Votes | % | ±% | |
|---|---|---|---|---|---|
| Labour | Paul Doughty | 2,376 | 51.2 | ||
| Liberal Democrats | Simon Holbrook | 1,219 | 26.3 | ||
| Conservative | Cyrus Ferguson | 662 | 14.3 | ||
| UKIP | James Bradshaw | 238 | 5.1 | ||
| Green | Mark Mitchell | 146 | 3.1 | ||
| Majority | 1,157 | 24.9 | |||
| Registered electors | 10,820 | ||||
| Turnout | 43.1 | ||||
| Labour gain from Liberal Democrats | Swing | ||||
Rock Ferry
| Party | Candidate | Votes | % | ±% | |
|---|---|---|---|---|---|
| Labour | Chris Meaden | 2,129 | 71.3 | ||
| Conservative | Barbara Poole | 369 | 12.4 | ||
| UKIP | Ann Flynn | 225 | 7.5 | New | |
| Liberal Democrats | Peter Heppinstall | 164 | 5.5 | ||
| Green | Joy Hogg | 100 | 3.3 | ||
| Majority | 1,760 | 58.9 | |||
| Registered electors | 9,630 | ||||
| Turnout | 31.2 | ||||
| Labour hold | Swing | ||||
Seacombe
| Party | Candidate | Votes | % | ±% | |
|---|---|---|---|---|---|
| Labour | Chris Jones | 2,111 | 64.4 | ||
| Conservative | Denis Knowles | 677 | 20.6 | ||
| UKIP | Christopher Wellstead | 286 | 8.7 | ||
| Green | Timothy Denton | 104 | 3.2 | ||
| Liberal Democrats | Steve Pitt | 101 | 3.1 | ||
| Majority | 1,434 | 43.8 | |||
| Registered electors | 10,482 | ||||
| Turnout | 31.5 | ||||
| Labour gain from Conservative | Swing | ||||
Upton
| Party | Candidate | Votes | % | ±% | |
|---|---|---|---|---|---|
| Labour | Tony Smith | 2,850 | 57.6 | ||
| Conservative | Geoff Gubb | 1,495 | 30.2 | ||
| Liberal Democrats | Alan Davies | 226 | 4.6 | ||
| UKIP | Emma Sayle-Adam | 221 | 4.5 | New | |
| Green | Lesley Hussenbux | 158 | 3.2 | ||
| Majority | 1,355 | 27.4 | |||
| Registered electors | 12,087 | ||||
| Turnout | 41.1 | ||||
| Labour hold | Swing | ||||
Wallasey
| Party | Candidate | Votes | % | ±% | |
|---|---|---|---|---|---|
| Conservative | Paul Hayes | 2,670 | 49.2 | ||
| Labour | Phil Mount | 2,030 | 37.4 | ||
| Liberal Democrats | John Codling | 258 | 4.8 | ||
| UKIP | Ian Watson | 236 | 4.4 | ||
| Green | James Brady | 230 | 4.2 | ||
| Majority | 640 | 11.8 | |||
| Registered electors | 11,873 | ||||
| Turnout | 45.9 | ||||
| Conservative hold | Swing | ||||
West Kirby and Thurstaston
| Party | Candidate | Votes | % | ±% | |
|---|---|---|---|---|---|
| Conservative | David Elderton | 2,820 | 53.0 | ||
| Labour | Tony Norbury | 1,358 | 25.5 | ||
| Liberal Democrats | John Cresswell | 483 | 9.1 | ||
| Green | Shirley Johnson | 279 | 5.2 | ||
| UKIP | George Robinson | 223 | 4.2 | ||
| Independent | Charles Barnes | 154 | 2.9 | New | |
| Majority | 1,462 | 27.5 | |||
| Registered electors | 10,343 | ||||
| Turnout | 51.7 | ||||
| Conservative hold | Swing | ||||
Changes between 2011 and 2012
| Date | Ward | Name | Previous affiliation | New affiliation | Circumstance | ||
|---|---|---|---|---|---|---|---|
| 16 May 2011 | Bromborough | Steve Niblock | Liberal Democrats | Labour | Defected.[59] | ||
Notes
References
- ^ a b c "Election Result for 5 May 2011 Summary". Wirral Metropolitan Borough Council.
- ^ "Election Result for Bebington ward on 5 May 2011". Wirral Metropolitan Borough Council.
- ^ "Councillor Jerry Williams". Wirral Metropolitan Borough Council. 7 August 2023.
- ^ "Election Result for Bidston and St. James ward on 5 May 2011". Wirral Metropolitan Borough Council.
- ^ "Councillor Harry Smith". Wirral Metropolitan Borough Council. Archived from the original on 12 June 2018. Retrieved 9 August 2018.
- ^ "Election Result for Birkenhead and Tranmere ward on 5 May 2011". Wirral Metropolitan Borough Council.
- ^ "Councillor Phil Davies". Wirral Metropolitan Borough Council. Archived from the original on 12 June 2018. Retrieved 9 August 2018.
- ^ "Councillor Pat Cleary". Wirral Metropolitan Borough Council. 7 August 2023.
- ^ "Election Result for Bromborough ward on 5 May 2011". Wirral Metropolitan Borough Council.
- ^ "Councillor Joe Walsh". Wirral Metropolitan Borough Council.
- ^ "Councillor Bob Moon". Wirral Metropolitan Borough Council. Archived from the original on 12 June 2018. Retrieved 9 August 2018.
- ^ "Councillor Kathy Hodson". Wirral Metropolitan Borough Council. 7 August 2023.
- ^ "Election Result for Clatterbridge ward on 5 May 2011". Wirral Metropolitan Borough Council.
- ^ "Councillor Adam Sykes". Wirral Metropolitan Borough Council.
- ^ "Election Result for Claughton ward on 5 May 2011". Wirral Metropolitan Borough Council.
- ^ "Councillor Steve Foulkes". Wirral Metropolitan Borough Council. 7 August 2023.
- ^ "Election Result for Eastham ward on 5 May 2011". Wirral Metropolitan Borough Council.
- ^ "Councillor Dave Mitchell". Wirral Metropolitan Borough Council. Archived from the original on 12 June 2018. Retrieved 9 August 2018.
- ^ "Election Result for Greasby, Frankby and Irby ward on 5 May 2011". Wirral Metropolitan Borough Council.
- ^ "Councillor Mike Hornby". Wirral Metropolitan Borough Council.
- ^ "Councillor Tony Cox". Wirral Metropolitan Borough Council.
- ^ "Councillor Peter Reisdorf". Wirral Metropolitan Borough Council. Archived from the original on 12 June 2018. Retrieved 9 August 2018.
- ^ "Election Result for Heswall ward on 5 May 2011". Wirral Metropolitan Borough Council.
- ^ "Councillor Andrew Hodson". Wirral Metropolitan Borough Council. 7 August 2023.
- ^ "Election Result for Hoylake and Meols ward on 5 May 2011". Wirral Metropolitan Borough Council.
- ^ "Councillor Gerry Ellis". Wirral Metropolitan Borough Council. Archived from the original on 12 June 2018. Retrieved 9 August 2018.
- ^ "Councillor Sylvia Hodrien". Wirral Metropolitan Borough Council.
- ^ "Election Result for Leasowe and Moreton East ward on 5 May 2011". Wirral Metropolitan Borough Council.
- ^ "Councillor Ron Abbey". Wirral Metropolitan Borough Council. Archived from the original on 12 June 2018. Retrieved 9 August 2018.
- ^ "Election Result for Liscard ward on 5 May 2011". Wirral Metropolitan Borough Council.
- ^ "Councillor Bernie Mooney". Wirral Metropolitan Borough Council.
- ^ "Councillor Karen Hayes". Wirral Metropolitan Borough Council.
- ^ "Election Result for Moreton West and Saughall Massie ward on 5 May 2011". Wirral Metropolitan Borough Council.
- ^ "Councillor Steve Williams". Wirral Metropolitan Borough Council.
- ^ "Election Result for New Brighton ward on 5 May 2011". Wirral Metropolitan Borough Council.
- ^ "Councillor Pat Hackett". Wirral Metropolitan Borough Council. Archived from the original on 12 June 2018. Retrieved 9 August 2018.
- ^ "Councillor Tony Pritchard". Wirral Metropolitan Borough Council. Archived from the original on 12 June 2018. Retrieved 9 August 2018.
- ^ "Election Result for Oxton ward on 5 May 2011". Wirral Metropolitan Borough Council.
- ^ "Councillor Stuart Kelly". Wirral Metropolitan Borough Council. 7 August 2023.
- ^ "Councillor Matthew Patrick". Wirral Metropolitan Borough Council.
- ^ "Election Result for Pensby and Thingwall ward on 5 May 2011". Wirral Metropolitan Borough Council.
- ^ "Councillor Don McCubbin". Wirral Metropolitan Borough Council. Archived from the original on 12 July 2018. Retrieved 9 August 2018.
- ^ "Councillor Michael Sullivan". Wirral Metropolitan Borough Council. Archived from the original on 12 July 2018. Retrieved 9 August 2018.
- ^ "Election Result for Prenton ward on 5 May 2011". Wirral Metropolitan Borough Council.
- ^ "Councillor Paul Doughty". Wirral Metropolitan Borough Council.
- ^ "Councillor Simon Holbrook". Wirral Metropolitan Borough Council. Archived from the original on 12 June 2018. Retrieved 9 August 2018.
- ^ "Election Result for Rock Ferry ward on 5 May 2011". Wirral Metropolitan Borough Council.
- ^ "Councillor Chris Meaden". Wirral Metropolitan Borough Council. Archived from the original on 12 June 2018. Retrieved 9 August 2018.
- ^ "Election Result for Seacombe ward on 5 May 2011". Wirral Metropolitan Borough Council.
- ^ "Councillor Chris Jones". Wirral Metropolitan Borough Council. Archived from the original on 12 July 2018. Retrieved 9 August 2018.
- ^ "Councillor Denis Knowles". Wirral Metropolitan Borough Council. Archived from the original on 12 June 2018. Retrieved 9 August 2018.
- ^ "Election Result for Upton ward on 5 May 2011". Wirral Metropolitan Borough Council.
- ^ "Councillor Tony Smith". Wirral Metropolitan Borough Council. Archived from the original on 12 June 2018. Retrieved 9 August 2018.
- ^ "Election Result for Wallasey ward on 5 May 2011". Wirral Metropolitan Borough Council.
- ^ "Councillor Paul Hayes". Wirral Metropolitan Borough Council.
- ^ "Election Result for West Kirby and Thurstaston ward on 5 May 2011". Wirral Metropolitan Borough Council.
- ^ "Councillor David M Elderton". Wirral Metropolitan Borough Council. Archived from the original on 12 June 2018. Retrieved 9 August 2018.
- ^ "Councillor Tony Norbury". Wirral Metropolitan Borough Council.
- ^ "Wirral Lib Dem Steve Niblock defects to Labour Party". BBC News. 16 May 2011. Retrieved 28 December 2018.