2006 United States House of Representatives elections in South Carolina|
|
|
|
|
Majority party
|
Minority party
|
|
|
|
|
| Party
|
Republican
|
Democratic
|
| Last election
|
4
|
2
|
| Seats won
|
4
|
2
|
| Seat change
|

|
|
| Popular vote
|
599,615
|
472,719
|
| Percentage
|
55.20%
|
43.52%
|
| Swing
|
 8.25% 8.25%
|
 9.72% 9.72%
|
|
 Party gains Party gains District results District results County results County results
|
Republican
40–50%
50–60%
60–70%
70–80%
|
Democratic
50–60%
60–70%
70–80%
|
Winners
Republican Hold
Democratic Hold
| |
The 2006 United States House of Representatives elections in South Carolina were held on November 7, 2006 to select six Representatives for two-year terms from the state of South Carolina. The primary elections for the Democrats and the Republicans were held on June 13 and the runoff elections were held two weeks later on June 27. All six incumbents were re-elected and the composition of the state delegation remained four Republicans and two Democrats.
Overview
| United States House of Representatives elections in South Carolina, 2006[1]
|
| Party
|
Votes
|
Percentage
|
Seats
|
+/–
|
|
|
Republican
|
599,615
|
55.20%
|
4
|
—
|
|
|
Democratic
|
472,719
|
43.52%
|
2
|
—
|
|
|
Green
|
8,847
|
0.81%
|
0
|
—
|
|
|
Libertarian
|
4,467
|
0.41%
|
0
|
—
|
|
|
Independents
|
558
|
0.05%
|
0
|
—
|
| Totals
|
1,086,206
|
100.00%
|
6
|
—
|
District 1
2006 South Carolina's 1st congressional district election|
|
|
|
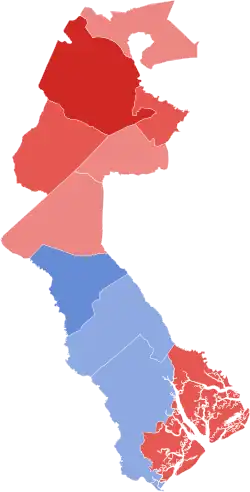
 County results
Brown: 50–60% 60–70% |
|
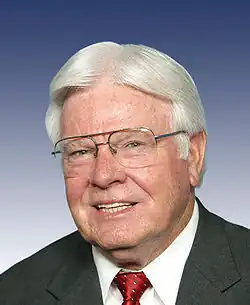
Congressman Henry E. Brown, Jr. ran for a fourth term in this conservative, South Caroline coastal district and faced Democratic candidate Randy Maatta and Green Party candidate James Dunn. Though Brown was re-elected by a comfortable margin, it was a smaller margin than in previous elections.
Predictions
District 2
2006 South Carolina's 2nd congressional district election|
|
|
|
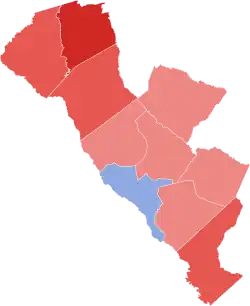
 County results
Wilson: 50–60% 60–70% 70–80%
Ellisor: 50–60% 60–70% |
|
Congressman Joe Wilson ran for re-election in this conservative district that starts along the South Carolina coastline and reaches into the central region of the state. Wilson faced Democratic candidate Michael Ellisor in a repeat of the 2004 election, and, though he was re-elected, his margin of victory was reduced somewhat by the Democratic wave sweeping through the country.
Predictions
District 3
2006 South Carolina's 3rd congressional district election|
|
|
|
 County results
Barrett: 50–60% 60–70% 70–80%
Ballenger: 50–60% |
|
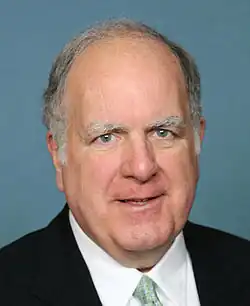
Though Congressman J. Gresham Barrett represented the most conservative district in South Carolina, he was held to just over sixty percent of the vote by Democratic candidate Lee Ballenger in 2006, in part due to the anti-Republican sentiment nationwide.
Predictions
District 4
2006 South Carolina's 4th congressional district election|
|
|
|
 County results
Inglis: 50–60% 60–70% |
|
Republican Congressman Bob Inglis, seeking his fifth term overall and his second consecutive term, faced off against Democratic candidate William Griffith, Libertarian John Cobin, and Green candidate C. Faye Walters. He won re-election with over 64% of the vote. This district, based in Spartanburg and Greenville, has a tendency to elect Republicans.
Predictions
District 5
2006 South Carolina's 5th congressional district election|
|
|
|
 County results
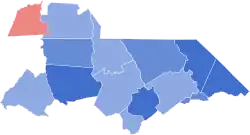
Spratt: 50–60% 60–70% 70–80%
Norman: 50–60% |
|
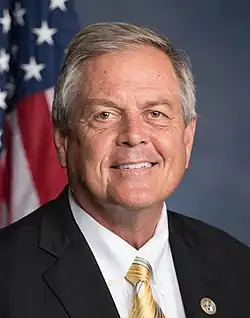
Long-serving Democratic Congressman John Spratt, in a bid for his thirteenth term, faced a credible challenge from State Representative Ralph Norman. Though Spratt's margin of victory was reduced from previous levels, he was still able to edge out Norman with nearly fifty-seven percent of the vote in this conservative, northern district.
Predictions
District 6
2006 South Carolina's 6th congressional district election|
|
|
|
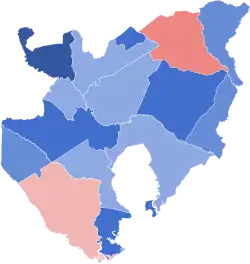 County results
Clyburn: 50–60% 60–70% 70–80% 80–90%
McLeod: 40–50% 50–60% |
|
Facing off against Republican challenger Gary McLeod for the third time in this staunchly liberal, African-American majority district, incumbent Democratic Congressman Jim Clyburn overwhelmingly won election to an eighth term in Congress.
Predictions
See also
References
- ^ "Office of the Clerk, U.S. House of Representatives".
- ^ a b c d e f "2006 Competitive House Race Chart" (PDF). House: Race Ratings. Cook Political Report. November 6, 2006. Archived from the original on September 27, 2007. Retrieved November 20, 2023.
- ^ a b c d e f "2006 House Ratings". House Ratings. The Rothenberg Political Report. November 6, 2006. Archived from the original on November 7, 2006. Retrieved November 20, 2023.
- ^ a b c d e f "2006 House". Sabato's Crystal Ball. November 6, 2006. Archived from the original on November 10, 2006. Retrieved November 20, 2023.
- ^ a b c d e f "Battle for the House of Representatives". realclearpolitics.com. Real Clear Politics. November 7, 2006. Archived from the original on November 9, 2006. Retrieved December 12, 2023.
- ^ a b c d e f "Balance of Power Scorecard: House". cqpolitics.com. Congressional Quarterly Inc. Archived from the original on November 17, 2006. Retrieved November 20, 2023.
External links
|
|---|
U.S.
Senate | |
|---|
U.S.
House
(election
ratings) | |
|---|
| Governors | |
|---|
Attorneys
General | |
|---|
| State officials | |
|---|
State
legislatures | |
|---|
| Mayors |
- Anaheim, CA
- Anchorage, AK
- Austin, TX
- Fort Lauderdale, FL
- Irvine, CA
- Long Beach, CA
- Louisville, KY
- Newark, NJ
- New Orleans, LA
- Richmond, CA
- San Bernardino, CA
- San Jose, CA
- Norfolk, VA
- Oakland, CA
- Providence, RI
- Santa Ana, CA
- Sioux Falls, SD
- Tallahassee, FL
- Tulsa, OK
- Washington, DC
|
|---|
| Local |
- Orange County, FL
- St. Charles County, MO
- St. Louis County, MO
|
|---|
| States | |
|---|


.jpg)