2004 United States House of Representatives elections in Tennessee Turnout 66.32% [ 1] pp
Majority party
Minority party
Party
Democratic
Republican
Last election
5
4
Seats won
5
4
Seat change
Popular vote
1,031,959
1,160,821
Percentage
46.51%
52.32%
Swing
Party gains District results County results Democratic hold Republican hold
Democratic
40–50%
50–60%
60–70%
70–80%
80–90%
Republican
50–60%
60–70%
70–80%
80–90%
90–100%
The 2004 congressional elections in Tennessee was held on November 2, 2004, to determine who will represent the state of Tennessee in the United States House of Representatives . Following the 2004 elections, no seats changed hands, leaving the Tennessee delegation at a 5-4 Democratic majority.[ 2] [ 3]
Tennessee was one of four states in which the party that won the state's popular vote did not win a majority of seats in 2004, the other states being Colorado , Connecticut , and New Mexico .
Overview
United States House of Representatives elections in Tennessee, 2004[ 4]
Party
Votes
Percentage
Seats
+/–
Democratic
1,031,959
46.51%
5
—
Republican
1,160,821
52.32%
4
—
Independents
25,686
1.16%
0
—
Totals
2,218,738
100.00%
9
—
(There was 272 Write-in votes that were added to the statewide total number of votes).
Popular vote
Republican
52.32%
Democratic
46.51%
Other
1.17%
House seats
Democratic
55.56%
Republican
44.44%
By district
District 1
2004 Tennessee's 1st congressional district election
County resultsJenkins: 70–80% 80–90%
Predictions
Results
District 2
2004 Tennessee's 2nd congressional district election
County resultsDuncan: 70–80% 80–90%
Predictions
Results
District 3
2004 Tennessee's 3rd congressional district election
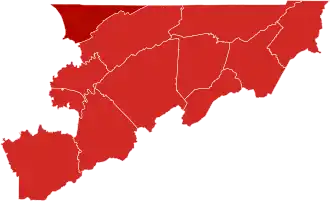
County resultsWamp: 50–60% 60–70% 70–80%
Predictions
Results
District 4
2004 Tennessee's 4th congressional district election
County resultsDavis: 40–50% 50–60% 60–70%Bowling: 50–60%
Predictions
Results
District 5
Predictions
Results
District 6
Predictions
Results
District 7
Predictions
Results
District 8
Predictions
Results
District 9
Predictions
Results
See also
References
^ "Tennessee Voter Turnout in 2004" . Tennessee Secretary of State . November 2, 2004. Retrieved February 28, 2023 .^ "CNN.com Election 2004" . www.cnn.com . Retrieved February 13, 2024 .^ "The Election of 2004 – Congressional Election Results" . Retrieved February 13, 2024 .^ "Historical Election Results | Tennessee Secretary of State" . sos.tn.gov . Retrieved February 13, 2024 .^ a b c d e f g h i "2004 Competitive House Race Chart" (PDF) . House: Race Ratings . Cook Political Report. October 29, 2004. Archived from the original (PDF) on May 10, 2006. Retrieved November 21, 2023 .^ a b c d e f g h i "2004 House" . Sabato's Crystal Ball. November 3, 2004. Archived from the original on November 11, 2004. Retrieved November 24, 2023 .
U.S. U.S. (election ) Governors Attorneys State officials State Mayors
Anaheim, CA Anchorage, AK Austin, TX Fort Lauderdale, FL Irvine, CA Long Beach, CA Louisville, KY Newark, NJ New Orleans, LA Richmond, CA San Bernardino, CA San Jose, CA Norfolk, VA Oakland, CA Providence, RI Santa Ana, CA Sioux Falls, SD Tallahassee, FL Tulsa, OK Washington, DC Local
Orange County, FL
St. Charles County, MO
St. Louis County, MO
States


.png)