1947 Stretford Municipal Borough Council election
| |||||||||||||||||||||||||||||||||||||||||||||
8 of 32 seats to Stretford Municipal Borough Council 16 seats needed for a majority | |||||||||||||||||||||||||||||||||||||||||||||
|---|---|---|---|---|---|---|---|---|---|---|---|---|---|---|---|---|---|---|---|---|---|---|---|---|---|---|---|---|---|---|---|---|---|---|---|---|---|---|---|---|---|---|---|---|---|
| |||||||||||||||||||||||||||||||||||||||||||||
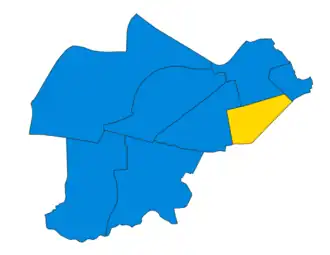 Map of results of 1947 election | |||||||||||||||||||||||||||||||||||||||||||||
| |||||||||||||||||||||||||||||||||||||||||||||
Elections to Stretford Council were held on Saturday, 1 November 1947. One third of the councillors were up for election, with each successful candidate to serve a three-year term of office. The Conservative Party retained overall control of the council.[1][2]
Election result
| Party | Votes | Seats | Full Council | |||||||
| Conservative Party | 15,243 (51.7%) | 7 (87.5%) | 7 / 8
|
20 (62.5%) | 20 / 32
| |||||
| Liberal Party | 2,750 (9.3%) | 1 (12.5%) | 1 / 8
|
7 (21.9%) | 7 / 32
| |||||
| Labour Party | 11,354 (38.5%) | 0 (0.0%) | 0 / 8
|
5 (15.6%) | 5 / 32
| |||||
| Communist Party | 135 (0.5%) | 0 (0.0%) | 0 / 8
|
0 (0.0%) | 0 / 32
| |||||
Full council
| 5 | 7 | 20 |
Aldermen
| 1 | 2 | 5 |
Councillors
| 4 | 5 | 15 |
Ward results
Clifford
| Party | Candidate | Votes | % | ±% | |
|---|---|---|---|---|---|
| Conservative | T. Butterworth | 1,942 | 58.9 | N/A | |
| Labour | G. Ney* | 1,286 | 39.0 | −13.5 | |
| Communist | R. Watts | 68 | 2.1 | N/A | |
| Majority | 656 | 19.9 | |||
| Turnout | 3,296 | ||||
| Conservative gain from Labour | Swing | ||||
Cornbrook
| Party | Candidate | Votes | % | ±% | |
|---|---|---|---|---|---|
| Conservative | J. M. Maxted | 1,926 | 60.3 | +3.9 | |
| Labour | J. Stoddart | 1,269 | 39.7 | −3.9 | |
| Majority | 657 | 20.6 | |||
| Turnout | 3,195 | ||||
| Conservative hold | Swing | ||||
Longford
| Party | Candidate | Votes | % | ±% | |
|---|---|---|---|---|---|
| Conservative | R. T. Lee* | 2,576 | 62.4 | +4.6 | |
| Labour | H. Pyper | 1,552 | 37.6 | −4.6 | |
| Majority | 1,024 | 24.8 | +9.2 | ||
| Turnout | 4,128 | ||||
| Conservative hold | Swing | ||||
Park
| Party | Candidate | Votes | % | ±% | |
|---|---|---|---|---|---|
| Conservative | W. P. Downes | 1,926 | 52.0 | +8.7 | |
| Labour | H. Ney* | 1,778 | 48.0 | −8.7 | |
| Majority | 148 | 4.0 | |||
| Turnout | 3,704 | ||||
| Conservative gain from Labour | Swing | ||||
Stretford
| Party | Candidate | Votes | % | ±% | |
|---|---|---|---|---|---|
| Conservative | F. Cawley* | 2,446 | 65.5 | +4.2 | |
| Labour | G. H. Evans | 1,291 | 34.5 | −4.2 | |
| Majority | 1,155 | 31.0 | +8.4 | ||
| Turnout | 3,737 | ||||
| Conservative hold | Swing | ||||
Talbot North
| Party | Candidate | Votes | % | ±% | |
|---|---|---|---|---|---|
| Conservative | F. Matthews | 2,114 | 50.6 | +2.6 | |
| Labour | W. Fearnhead* | 2,000 | 47.8 | +1.8 | |
| Communist | A. Bates | 67 | 1.6 | −2.4 | |
| Majority | 114 | 2.7 | +0.7 | ||
| Turnout | 4,181 | ||||
| Conservative gain from Labour | Swing | ||||
Talbot South
| Party | Candidate | Votes | % | ±% | |
|---|---|---|---|---|---|
| Conservative | A. W. Davison | 2,313 | 61.0 | N/A | |
| Labour | E. Hall* | 1,481 | 39.0 | −2.9 | |
| Majority | 832 | 22.0 | |||
| Turnout | 3,794 | ||||
| Conservative gain from Labour | Swing | ||||
Trafford
| Party | Candidate | Votes | % | ±% | |
|---|---|---|---|---|---|
| Liberal | W. R. Cannell* | 2,750 | 79.8 | +6.2 | |
| Labour | S. Bradshaw | 697 | 20.2 | −6.2 | |
| Majority | 2,053 | 59.6 | +12.4 | ||
| Turnout | 3,447 | ||||
| Liberal hold | Swing | ||||